Question 1131074: The table shows the number y of pineapple plants in a garden x years since 2004. My question is I did my graph with my points; (2,4), (3,7), (4,9), (7,15), (8,16), and (9,19). When I went to find the slope, I got 3, but when I went to find the y-intercept I got a negative number. How can that be if the answer is a positive slope?
Answer by Boreal(15235)   (Show Source): (Show Source):
You can put this solution on YOUR website! The y-intercept and the slope are not dependent. The y-intercept is where x=0, and it is possible in such a plot that the positive values of x are useful but the zero value is not.
one line from the first two points is y-y1=m(x-x1) m slope, (x1, y1) a point
y-4=3(x-7)
y=3x-3
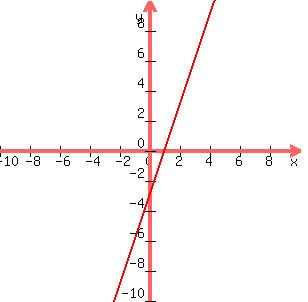
Here, when x=1, y=0, but there are no points given where this was an issue.
Also, since the slope between adjacent points is not always 3 , and the slope between the first and last is 15/7, there are different possible lines, and the best slope (minimum least square differences) is regression. To answer your question, however, positive slopes and negative intercepts are certainly allowable.
|
|
|