Question 1121879: To graph the equation y=11/8x^3• , first plot 5 points on the graph: one point with x = 0, two points with negative x-values, and two points with positive x-values.
Found 2 solutions by Boreal, Theo:
Answer by Boreal(15235)   (Show Source): (Show Source):
You can put this solution on YOUR website! y=11/(8x^3) is graphed. If the problem is (11/8)x^3, that is a different matter
x can't be 0, or the equation is undefined. As x approaches 0 from the positive side, the equation goes to positive infinity. As x approaches 0 from the negative side, the equation goes to negative infinity.
x=1 y=11/8
x=2 y=11/64
as x gets large, y goes to 0 from the positive side
x=-1, y=-11/8
x=-2, y=-11/64 and as x becomes more negative, y goes to 0 from the negative side
Answer by Theo(13342)  (Show Source): (Show Source):
You can put this solution on YOUR website! the equation is y = 11 / (8x^3).
when x = 0, y is undefined.
you would probably want to plot 2 points that are fairly close to 0 on each side to see which way the equation is trending right before it becomes undefined.
you would then probably want to plot 2 points further away on each side to see what else is happening with the curve.
i chose x = 0, plus or minus 1 and plus or minus 2.
when x = 0, y = 11 / 0 which is undefined.
when x = -1, y = 11 / (8 * (-1)^3) = -1.375
when x = -2, y = 11 / (8 * (-2)^3) = -.171875
when x = 1, y = 11 / (8 * 1^3) = 1.375
when x = 2, y = 11 / (8 * 2^3) = .171875
for this type of curve, 5 points is probably not enough, so i would probably want to plot more points to get a better idea of what the curve looks like.
i would pick something even closer to 0 and something even further away than plus or minus 2.
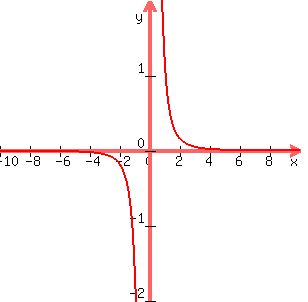
instead, i chose to use graphing software to show me what the curve should look like.
it looks like this:

if i had chosen values of x closer to 0, i would have seen that the graph rises higher and higher the closer i got to x = 0.
on the left side, it would get more and more negative.
on the right side, it would get more and more positive.
if i had chosen values of x farther from 0, i would have seen that the graph gets closer and closer to y = 0, the further out i went.
on the left side, it would get closer and closer to y = 0 but still remain negative.
on the right side, it would get closer and closer to y = 0 but still remain negative.
to demonstrate, i chose x plus or minus .1 and x = plus or minus 10.
when x = -.1, y = -1375.
when x = .1, y = 1375.
when x = -10, y = -.001375
when x = 10, y = .001375
to save myself from more manual calculations, i used excel to make a table of selected values to show you what they would tell you about the shape of the curve.
here's the table in excel.

the first two columns show the value of y when x = -20 to 20 in increments of 2.
the second two columns show the value of y when x = -10 to 10 in increments of 1.
the third two columns show the value of y when x = -1 to 1 in increments of .1.
the fourth two columns show the value of y when x = -.1 to .1 in increments of .01.
|
|
|