Question 1111985: The temperature of a patient during an illness is given by the function below, where T is the temperature, in degrees Fahrenheit, at time t, in days, after the onset of the illness. Graph the function using a graphing calculator and use the MAXIMUM feature to find at what time the patient's temperature was highest. What was the highest temperature?
T(t)=0.7tsquared +4.2t+98.6, 0 less than or equal too t less than or equal to 6
Answer by Theo(13342)   (Show Source): (Show Source):
You can put this solution on YOUR website! the function you provided is:
T(t) = .7 * t^2 + 4.2 * t + 98.6
it will not give you a maximum temperature.
this is because the coefficient of the t^2 term is positive.
in order for the function to give you a maximum temperature, the coefficint of the t^2 term has to be negative.
to graph this function:
let x = t and let y = T(t).
the function becomes y = .7 * x^2 + 4.2 * x + 98.6
the domain is 0 <= x <= 6.
here's the graph of the function as given.

you can see that there is no maximum.
there is only a minimum.
here is the graph of the function when the coefficient of the x^2 term is negative.
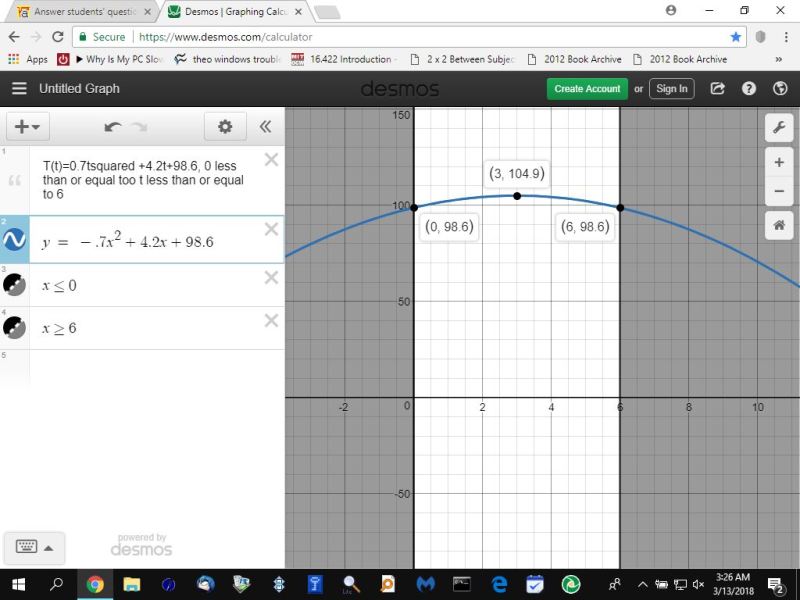
now you have a maximum.
from the graph, you can see that, when x = 0, the temperature is 98.6, and when x = 3, the temperature is 104.9, and when x = 6, the temperature is 98.6 again.
the maximum temperature is when x = 3.
the maximum temperature is 104.9 degrees.
we allowed y to be equal to T(t) and we allowed x to be equal to t in order for the graphing software to be able to handle the function.
some graphing functions can handle it the way it was originally written, but a lot can't, which is why we made the equivalency.
bottom line:
coefficient of the x^2 term, or the t^2 term, needs to be negative in order to get a maximum out of this quadratic function.
since the quadratic equation is in standard form, you could also find the maximum vaalue by using the formula:
x = -b/2a
the standard form of a quadratic equation is y = ax^2 + bx+ c, when y is equal to 0.
in this form:
a = the coefficient of the x^2 term.
b = the coefficient of the x term.
c = the constant term.
your equation of y = -.7 * x^2 + 4.2 * x + 98.6 gets you:
a = -.7
b = 4.2
c = 98.6
x = -b/2a becomes x = -4.2 / -1.4 which gets you x = 3.
when x = 3, y = -.7 * 3^2 + 4.2 * 3 + 98.6.
this results in y = 104.9
this agrees with what the graph is telling you, as it should.
|
|
|