Question 1111168: Describe the behavior of the curve y = - x3 + 2x2 + 4x - 5 at the point (1, 0).
Select all that apply.
increasing
decreasing
concave up
concave down
Found 2 solutions by josgarithmetic, KMST:
Answer by josgarithmetic(39666)   (Show Source): (Show Source):
Answer by KMST(5330)  (Show Source): (Show Source):
You can put this solution on YOUR website! The function's derivative,  or or  is is
 or or  . .
When  , ,  is indeed zero: is indeed zero:
 , ,
so the graph does go through (1,0).
When  , the derivative's value is , the derivative's value is
 , ,
so  is the slope of the tangent to the graph at (1,0) . is the slope of the tangent to the graph at (1,0) .
That means is  , and increasing steeply. , and increasing steeply.
Obviously, if is increasing around ,
it is NOT decreasing.
The second derivative,  or or  , ,
is the derivative of ;
 . .
For , the value of that second derivative is  . .
The fact that that value is negative means that is decreasing,
which means that the slope of the curve is increasing,
so it is growth rate is slowing,
and the curve is curling down.
It is   , like a frown. , like a frown.
If the graph of  is concave down, is concave down,
it is obviously NOT concave up.
The  of , of ,
and the  to that curve at (1,0) are shown below. to that curve at (1,0) are shown below.
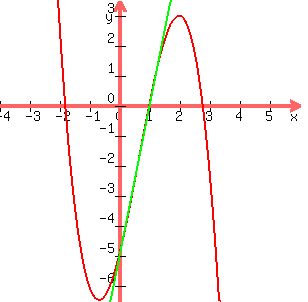
The graph above (and the one you could get in a graphing calculator),
shows that is increasing at (1,0).
Because the tangent slope is so steep,  not large, not large,
it is not visually obvious that the curve is concave down,
although changing the scale and zooming helps:

|
|
|