Question 1098238: how do you solve or simplify the problem:
y=X+3? and graph it?
I am very confused when it comes to these types of Algebra problems:(
Thank you so much for your help.
Found 3 solutions by math_helper, wilft1, MathTherapy:
Answer by math_helper(2461)   (Show Source): (Show Source):
You can put this solution on YOUR website! Don't fret. Its not complicated. y=x+3 is just a relationship (a "function" in this case) that relates input values of x to output values of y. Often, before graphing, one would make a table of values, for instance:
x y = x+3
� �����
-5 -2
-4 -1
-3 0
-2 1
-1 2
0 3
1 4
2 5
etc.
The step I used is somewhat arbitrary. In general use a step size for x that makes sense for you to get a good graph.
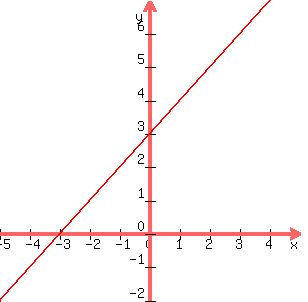
The graph of the data in the table is shown below. By convention, x values are plotted along the horizontal axis (and that axis is labelled the "x axis" while y values are plotted along the vertical axis, the "y axis." My recommendation is to practice, and it will become easy for you.
�
�
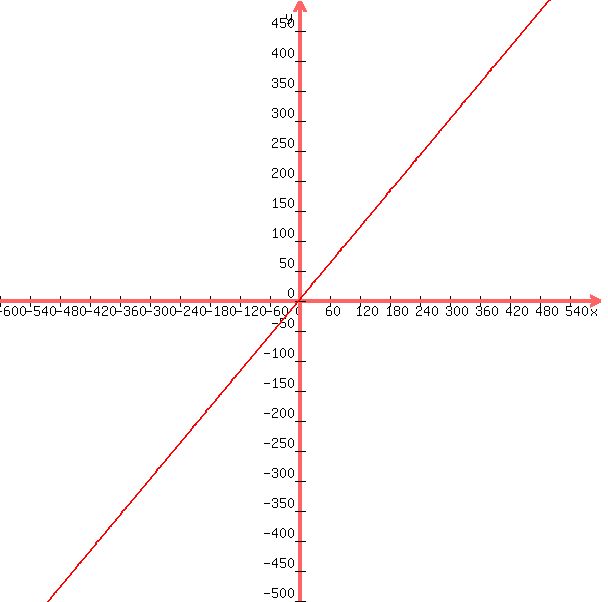
One last subtle point: since the possible values for x are not limited (i.e. the "domain" of x is not specified), we can assume x is any value at all, and the line graphed extends down and to the left and up to the right, forever. The graph below attempts to show you that zoomed-out view:
�
�
EDIT: When they say "graph" x and y, you plot points that correspond to x AND y. For example, in the table, one entry has x=1 and y=4, so starting at the origin (0.0), move right 1 place along the x-axis, then move up 4 along the y-axis to arrive at (1,4). When you see negative values for x, move LEFT along the x-axis, and for negative y-values move DOWN the y-axis.
Answer by wilft1(217)  (Show Source): (Show Source):
You can put this solution on YOUR website! this is simple substitution then plotting the points on a graph.
y = x + 3
substitute a number for x, then solve, your answer will be your y coordinate
x , y
1 , 4
2 , 5
4 , 7
7 , 10
now plot these points on a graph and draw a line through them
Answer by MathTherapy(10549)  (Show Source): (Show Source):
You can put this solution on YOUR website! how do you solve or simplify the problem:
y=X+3? and graph it?
I am very confused when it comes to these types of Algebra problems:(
Thank you so much for your help.
There's nothing to solve or simplify here. You ONLY need 2 points to graph a line. The EASIEST way to graph this is to find the intercepts (x and y).

1) Set x = 0 to find the y-intercept. You should get a value of 3 for y, and the coordinate point (0, 3). Plot this point!

2) Set y = 0 to find the x-intercept. You should get a value of - 3 for x, and the coordinate point (- 3, 0). Plot this point!

   Connect the 2 points!

That's it. You now have the graph of the linear equation: y = x + 3.

You don't need to plot a "million" points to graph a line, just 2, unless the instructions "say" so, or if it involves DIFFICULT fractions.

So, IGNORE anyone who tells you that you have to, as he/she is only advising you to do UNNECESSARY work. Who wants to do that? No-one I know!
|
|
|