SOLUTION: How do I graph this? y ≤ -x+18 x ≥ 4 y ≥ 3
Algebra
->
Graphs
-> SOLUTION: How do I graph this? y ≤ -x+18 x ≥ 4 y ≥ 3
Log On
Algebra: Graphs, graphing equations and inequalities
Section
Solvers
Solvers
Lessons
Lessons
Answers archive
Answers
Click here to see ALL problems on Graphs
Question 109000
:
How do I graph this?
y ≤ -x+18
x ≥ 4
y ≥ 3
Answer by
MathLover1(20850)
(
Show Source
):
You can
put this solution on YOUR website!
Solved by
pluggable
solver:
PLOT any graph
Graphing function
:
here is the graph
, for all
Solved by
pluggable
solver:
Graphing Linear Equations
This is the vertical line that cuts through 4 on the x-axis and the graph is shown below
The slope of this line is undefined. All vertical lines have an undefined slope since rise/run = x/0 and division by zero is undefined.
Solved by
pluggable
solver:
Find the equation of the line(with graph)---slope a nd y-intercept:given
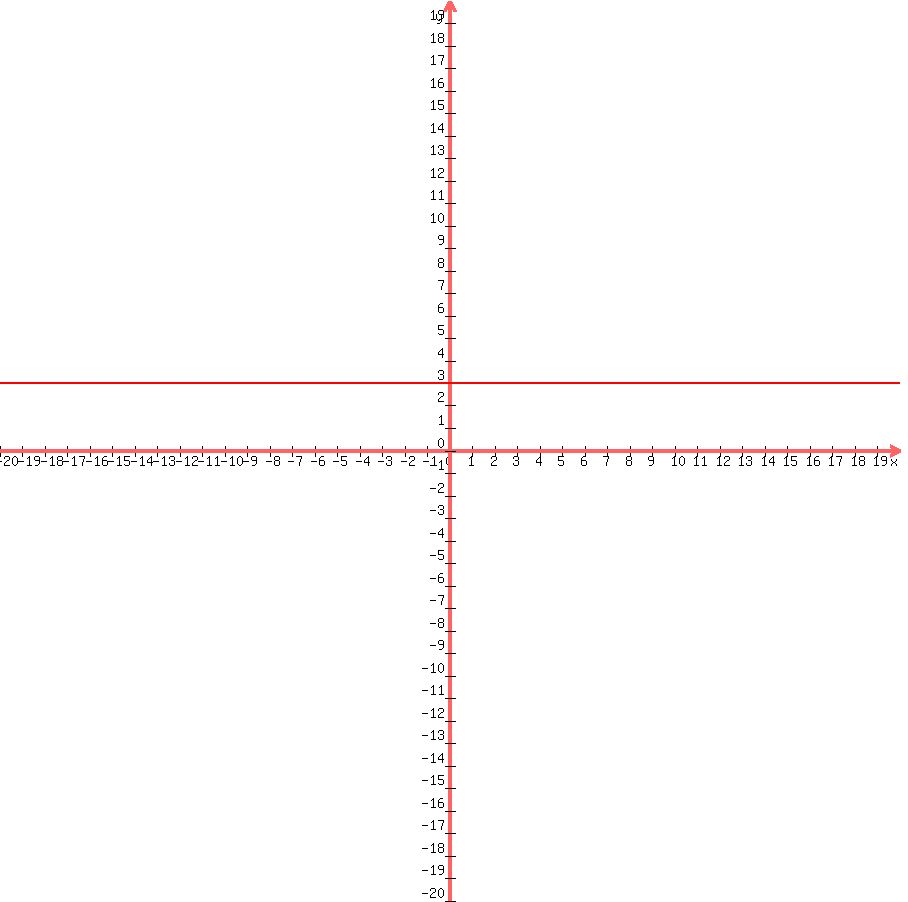
Using the slope-intercept form,
where m=slope, b=y-intercept,
and, substituting the values m=0 and b=3,
And the general equation is,