Question 1085912: Mr. Tran has $36,000 to invest, some in bonds and the rest in stocks. He has decided that the money invested in bonds must be at least twice as much as that in stocks. But the money invested in bonds must be greater than $20,000. If the bonds earn 5%, and the stocks earn 7%, how much money should he invest in each to maximize profit?
Answer by Theo(13342)   (Show Source): (Show Source):
You can put this solution on YOUR website!
x is equal to the amount invested in bonds.
y is equal to the amount invested in stocks.
your objective function is .05x + .07y, which you want to maximize.
your constraint functions are:
x + y = 36,000
this assumes all money is to be invested.
x >= 0
y >= 0
the amount invested can't be less than 0.
x >= 2y
the amount invested in bonds must be at least 2 times as great as the amount invested in stocks.
x >= 20,000
the amount invested in bonds must be at least 20,000.
summary of your requirements
objective function is .05x + .07y which you want to maximize.
constraint functions are:
x + y = 36,000
x >= 0
y >= 0
x >= 2y
x >= 20,000
using the desmos.com calcujlator, you would graph the constraint functions by reversing the inequalities, and keeping the equations as is.
therefore, you would graph:
x + y = 36,000
x <= 0
y <= 0
x <= 2y
x <= 20,000
the area on the graph that is not shaded will be the feasible region.
the solution needs to be on the line x + y = 36,000
the corner points of the feasible region become (x,y) = (24000,12000) and (x,y) = (36000,0)
that's where the maximum value of the objective function will be at.
your maximum value is when x = 24,000 and y = 12,000.
this gets you a profit of 2,040 each year, assuming the interest is compounded annually.
all constraints are satisfied when x = 24,000 and y = 12,000.
24,000 >= 2 * 12,000
24,000 >= 20,000
24,000 >= 0
12,000 >= 0
24,000 + 12,000 = 36,000
here's a picture of the graph.
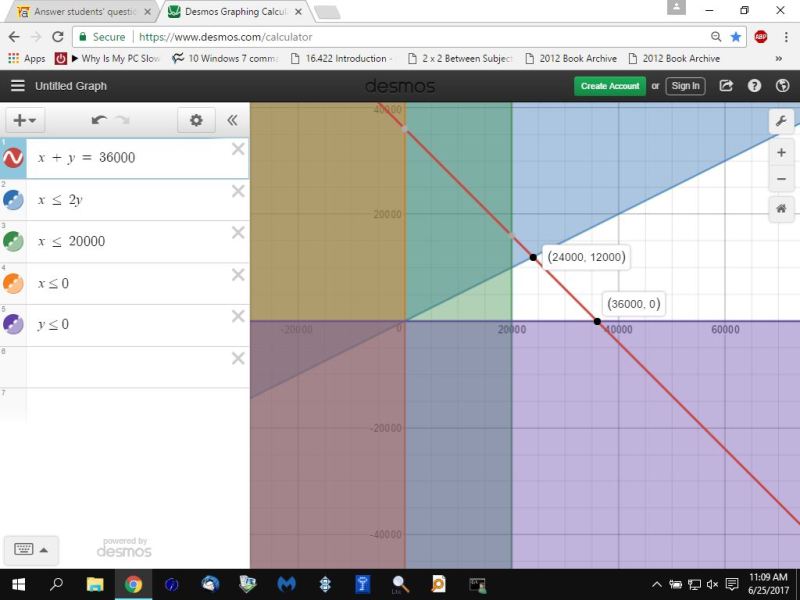
it's the area that is NOT shaded that is the feasible region.
this is opposite what you would do if you were creating the graph manually.
this is done because it is easier to see the feasible region when it is mechanically generated by the desmos.com calculator because of the way the calculator shades the regions desired.
try doing it the other way (graphing the inequalities as is rather than reversing them), and you'll see what i mean.
|
|
|