Question 1083734: PLEASE HELP I only have 20 mins left
The data show the number of pieces of mail delivered to a single home address each day for three weeks.
4, 0, 2, 6, 1, 0, 3, 4, 0, 2, 4, 1, 5, 2, 3, 1, 1, 2
Which statement is true about a graph representing the data? Check all that apply.
A. The number line of a dot plot would start at 1.
B. A dot plot would show 7 points for numbers greater than 2.
C. The intervals on a histogram should be 0 to 2, 3 to 4, and 5 to 6.
D. A histogram would have a maximum of 7 bars.
E. A histogram should not show a bar that includes 0 pieces of mail.
Found 2 solutions by Boreal, Theo:
Answer by Boreal(15235)   (Show Source): (Show Source):
Answer by Theo(13342)  (Show Source): (Show Source):
You can put this solution on YOUR website! the numbers on the bottom of the histogram would be 0 to 6.
the chart would show the frequency of occurrence for each number.
i believe selection B would be the best answer.
there are 7 data elements that are greater than 2.
a histogram i created is shown below:
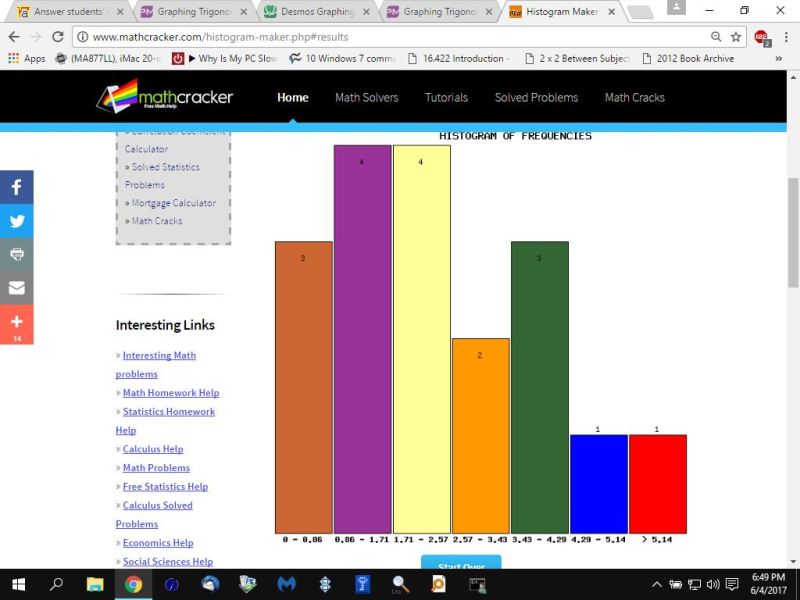
there are 7 categories.
the first category covers 0 letters per day.
the second 1 letter per day.
the third 2
the fourth 3
the fifth 4
the sixth 5
the seventh 6
for example, the first interval covers numbers from 0 to .86.
the only number of letters per day that fits in that category is 0 letters per day.
the second interval covers numbers from .86 to 1.71.
the only number of letters per day that fits in that category is 1 letter per day.
the third interval covers numbers from 1.71 to 2.57/
the only number of letters per day that fits in that category is 2 letters per day.
likewise, the fourth interval covers 3 letters per day, and the fifth interval covers 4 letters per day, and the sixth interval covers 5 letters per day, and the seventh interval covers 6 letters per day.
the intervals that contain more than 2 letters per day would be intervals that contain 3 letters per day, 4 letters per day, 5 letters per day, 6 letters per day.
that would be the last 4 intervals, starting with the interval that contains numbers between 2.57 and 3.43
the only number of letters per day that fits in that category is 3 letters per day.
if you count the number of occurrences in those last 4 intervals, they add up to 7.
that's why i believe selection B would fit the data best.
this was not easy to pick a selection because they were mixing general statements with statements that only applied to this data.
of the possible selections, this is what i think.
A. The number line of a dot plot would start at 1.
not necessarily.
B. A dot plot would show 7 points for numbers greater than 2.
for this set of data, yes.
C. The intervals on a histogram should be 0 to 2, 3 to 4, and 5 to 6.
could be but don't have to be.
D. A histogram would have a maximum of 7 bars.
could be true for this data.
you could possible create more, although not sure what value it would have for this data.
E. A histogram should not show a bar that includes 0 pieces of mail.
not true.
|
|
|