Question 107771: Solve each of a linear inequalities graphically.
x+2y<4
x-y>1
Found 2 solutions by MathLover1, jim_thompson5910:
Answer by MathLover1(20850)   (Show Source): (Show Source):
You can put this solution on YOUR website! 1.
 ...move ...move  to the right to the right

 } }
here is the graph, and you need to draw dashed line because solution is every  from from  to , excluding . to , excluding .
(, ]
| Solved by pluggable solver: Graphing Linear Equations |


This is the vertical line that cuts through 2 on the x-axis and the graph is shown below

The slope of this line is undefined. All vertical lines have an undefined slope since rise/run = x/0 and division by zero is undefined.
|
2.

graph:
thisi is a function  , and you need to shade the area where , and you need to shade the area where  . .
That will be area from (, ] ]
| Solved by pluggable solver: Graphing Linear Equations |
 Start with the given equation Start with the given equation
 Subtract Subtract  from both sides from both sides
 Multiply both sides by Multiply both sides by 
 Distribute Distribute
 Multiply Multiply
 Rearrange the terms Rearrange the terms
Reduce any fractions
So the equation is now in slope-intercept form ( ) where ) where  (the slope) and (the slope) and  (the y-intercept) (the y-intercept)
So to graph this equation lets plug in some points
Plug in x=-8

 Multiply Multiply
 Add Add
So here's one point (-8,-9)

Now lets find another point
Plug in x=-7

 Multiply Multiply
 Add Add
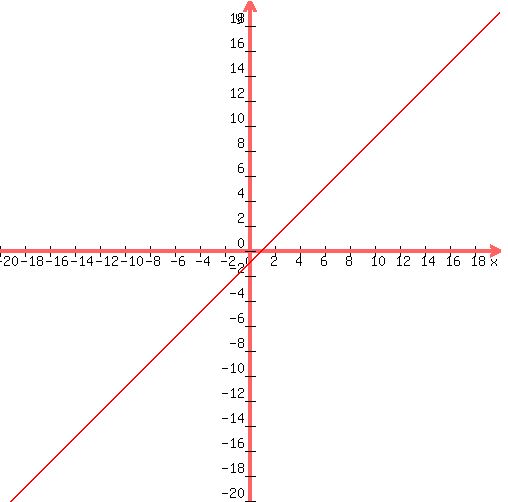
So here's another point (-7,-8). Add this to our graph

Now draw a line through these points
 So this is the graph of through the points (-8,-9) and (-7,-8) So this is the graph of through the points (-8,-9) and (-7,-8)
So from the graph we can see that the slope is  (which tells us that in order to go from point to point we have to start at one point and go up 1 units and to the right 1 units to get to the next point) the y-intercept is (0,)and the x-intercept is (,0) . So all of this information verifies our graph. (which tells us that in order to go from point to point we have to start at one point and go up 1 units and to the right 1 units to get to the next point) the y-intercept is (0,)and the x-intercept is (,0) . So all of this information verifies our graph.
We could graph this equation another way. Since this tells us that the y-intercept (the point where the graph intersects with the y-axis) is (0,).
So we have one point (0,)

Now since the slope is , this means that in order to go from point to point we can use the slope to do so. So starting at (0,), we can go up 1 units

and to the right 1 units to get to our next point

Now draw a line through those points to graph
 So this is the graph of through the points (0,-1) and (1,0) So this is the graph of through the points (0,-1) and (1,0)
|
Answer by jim_thompson5910(35256)  (Show Source): (Show Source):
You can put this solution on YOUR website!
Start with the given system of inequalities

In order to graph this system of inequalities, we need to graph each inequality one at a time.
First lets graph the first inequality
In order to graph , we need to graph the equation  (just replace the inequality sign with an equal sign). (just replace the inequality sign with an equal sign).
So lets graph the line (note: if you need help with graphing, check out this solver)
 graph of graph of
Now lets pick a test point, say (0,0). Any point will work, (just make sure the point doesn't lie on the line) but this point is the easiest to work with. Now evaluate the inequality with the test point
Substitute (0,0) into the inequality
 Plug in Plug in  and and 
 Simplify Simplify
(note: for some reason, some of the following images do not display correctly in Internet Explorer. So I would recommend the use of Firefox to see these images.)
Since this inequality is true, we simply shade the entire region that contains (0,0)
 Graph of with the boundary (which is the line in red) and the shaded region (in green) Graph of with the boundary (which is the line in red) and the shaded region (in green)
(note: since the inequality contains a less-than sign, this means the boundary is excluded. This means the solid red line is really a dashed line)
---------------------------------------------------------------
Now lets graph the second inequality
In order to graph , we need to graph the equation  (just replace the inequality sign with an equal sign). (just replace the inequality sign with an equal sign).
So lets graph the line (note: if you need help with graphing, check out this solver)
 graph of graph of
Now lets pick a test point, say (0,0). Any point will work, (just make sure the point doesn't lie on the line) but this point is the easiest to work with. Now evaluate the inequality with the test point
Substitute (0,0) into the inequality
 Plug in and Plug in and
 Simplify Simplify
Since this inequality is not true, we do not shade the entire region that contains (0,0). So this means we shade the region that is on the opposite side of the line
 Graph of with the boundary (which is the line in red) and the shaded region (in green) Graph of with the boundary (which is the line in red) and the shaded region (in green)
(note: since the inequality contains a greater-than sign, this means the boundary is excluded. This means the solid red line is really a dashed line)
---------------------------------------------------------------
So we essentially have these 2 regions:
Region #1
 Graph of Graph of
Region #2
 Graph of Graph of
When these inequalities are graphed on the same coordinate system, the regions overlap to produce this region. It's a little hard to see, but after evenly shading each region, the intersecting region will be the most shaded in.

Here is a cleaner look at the intersection of regions
 Here is the intersection of the 2 regions represented by the series of dots Here is the intersection of the 2 regions represented by the series of dots
|
|
|