Question 1058029: What will the value budgeted be for the years of 2005 through 2010?
Data and scatter plot: https://s22.postimg.org/de2yq0o4x/reference.png
Answer by josgarithmetic(39625)   (Show Source): (Show Source):
You can put this solution on YOUR website! Your graph shows strange values on the horizontal axis compared to the data table on the right. The years 2005 through 2010 are outside the years shown for your data table, so you would only be able to guess, or extrapolate; and for those, you would want to find the quadratic fit for the data which you have available. How good your extrapolated results would be, you cannot know until the actual data occurs. You will not have that until the data for 2005 through 2010 are collected.
You can pick the three points from your table which you believe best will fit a parabola to include the rest of the points as well as possible, and check to see how well the fitted curve reproduces your actual tabulated data.
Here is a selection of points you could try:
(1998, 271.3), (2001, 335.5), (2004, 490.6)
but if you take 1998 as time 0, then these points may be shown as
(0, 271.3), (3, 335.5), (6, 490.6)
Now form a system based on  using those three points. using those three points.
Plug in those points to make each equation, and simplify the resulting equations. Your system will be this:

Make the obvious substitution for c, and put your two equations in the variables a and b into a form  . .
Now you have a much simpler system in a and b:
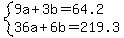
This can be handled well using Elimination Method, which I will not explain here.
The summary of results finding a, b, and c will be 
and the quadratic fit equation which still should be tested for how good the fit, is  . .
Remember carefully how x was assigned meaning here: x is for time in years AFTER 1998.
|
|
|