Question 1052647: Please, please help me graph this rational function 
I already solve its intercepts, asymptotes and symmetry. I know how to graph the asymptotes but I don't know how to make a curve on this without passing through the asymptotes.
Answer by josgarithmetic(39838)   (Show Source): (Show Source):
You can put this solution on YOUR website! Why? What happens NEAR the asymptotes?
The best way to figure how to sketch a graph is to identify the critical x values. Those would be any zeros of g(x) and any vertical asymptotes. These cut the x-axis into intervals for you to check how g(x) behaves.
x value        significance
-3             vertical asymptote
0              root or zero
3              vertical asymptote
Next look at the signs for g in each interval on x. Pick any x value in each interval.
INTERVAL             pick x          sign of g
(-infinity,-3)       -4              -5(-4)/((-4-3)(-4+3))=(+)/((-)(-))=POSITIVE
(-3,0]               -1              -k(-1)/((-)(+))=NEGATIVE
[0,3]                 1              -k(+)/((-)(+))=POSITIVE
[3,infinity)          10             -k(+)/((+)(+))=NEGATIVE
Think about g in those four intervals.
Starting very far from the left, approaching -3, g is positive, changing from very small to very large, and large without bound toward this asymptote.
Immediately to the right of this x=-3 asymptote, suddenly g is very large BUT NEGATIVE..., Do you see how this works?
Also notice change from negative to positive as g crosses the x-axis at 0.
,...
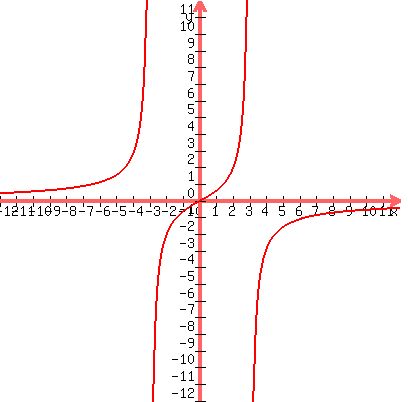
The horizontal asymptote is y=0.
| |
|