|
Question 1045202: Hello, I need help with my assignment. Can you help me please?
1.Graph the relation represented by y = x^2 + 1.
2.Find the domain and range.
Also could you explain how to get all the domain and range because in tutorials I could only see them getting only one. Thank you for the help!
Answer by Theo(13342)   (Show Source): (Show Source):
You can put this solution on YOUR website! here's the graph.
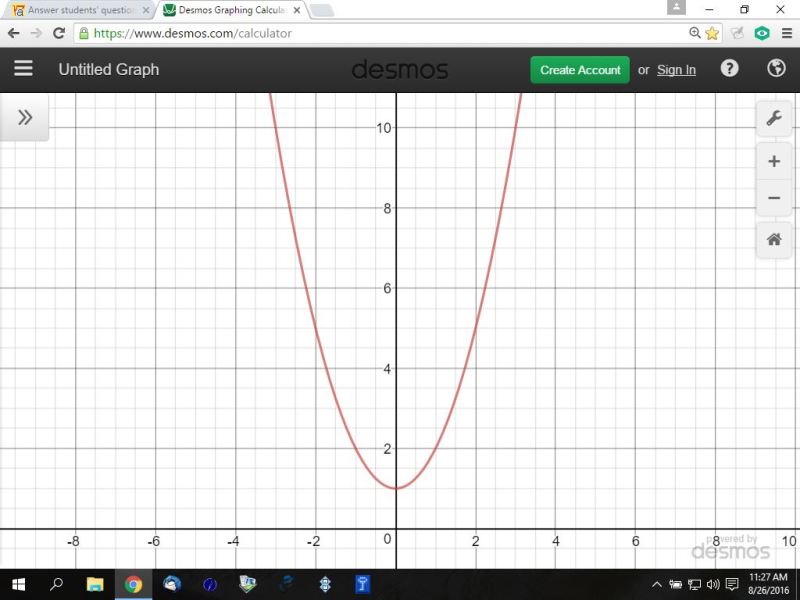
the domain is all real values of x.
the range is all real values of y >= 1.
you can't see it on the graph because the values of x extend all the way to plus and minus infinity.
similarly, the values of y extend all the way to plus infinity.
a simple test is to take a very high value of x and a vary low value of x, such as plus or minus 1000000.
use your calculator to find the value of y when y = x^2 + 1.
for 1000000, the value of y will be 1 * 10^12 based on what the calculator can show.
for -1000000, the value of y will be 1 * 10^12 again.
you made x very very large in a negative and positive direction and the value of y became very very large in a positive direction.
all values of x are in the domain because there is no value of x that's not real.
based on the equation, y can be any value of y that's positive and greaer than or equal to 1.
when x = 0, y = 1
y is positive when x gets greater than 0 in a positive or negative direction.
here's a tutorial that might help.
if you have any more questions on this topic, or have another specific problem regarding it that you are struggling with, send me an email.
http://www.intmath.com/functions-and-graphs/2a-domain-and-range.php
be aware that most of the time they are talking about functions, which are subsets of equation.
if there is only value of y for each and every value of x, then you have a function.
if there can be more than one value of y for any value of x, then you have a relation.
the equation you gave me is a function.
here's a graph of an equation that is a rerlation and not a function.
the equation is y^2 = x
solve for y in that equation and you will get y = plus or minus square root of (x).
the domain is all real values of x that are greater than or equal to 0.
those values of x will create real values of y.
negative values of x will not create real values of y because the square root of a negative number is not real.
here's the graph:

the domain is all real value of x >= 0.
the range is all real values of y.
you can see that the graph doesn't show anything for any values of x < 0.
this is because the graph will only show the real values of y.
any value of x > 0 will result in a real value of plus or minus y.
this equaton is not a function because there are more than one possible value of y for any one distinct value of x.
for erxample, when x = 4, y = plus or minus 2.
|
|
|
| |