Question 1037013: I need help making a graph from a table of values for this function

Determine consecutive integer values of x between which each
real zero is located.
Between which two xconsecutive integers does the x-coordinate
of the relative maxima and relative minima occur?
Found 2 solutions by Boreal, Edwin McCravy:
Answer by Boreal(15235)   (Show Source): (Show Source):
You can put this solution on YOUR website! x^4 - 2x^3 - 6x^2 + 8x + 5 ; 2 sign changes, 2 negative roots
f(-x)=x^4+2x^3-6x^2-8x+5; 2 sign changes, 2 or 0 positive roots
x=-4
x=-3. f(x)=62
x=-2, f(x)=-3
x=-1, f(x)=-10
x=0, f(x)=5
x=1, f(x)=6
x=2, f(x)=-3
x=3, f(x)=2
positive roots between 1 and 2, 2 and 3
negative roots between 0 and -1 and -2 and -3
Relative maximum between 0 and 1 (0.85)
Relative minima between -1 and -1 (-1.46) and 2 and 3 (2.40)

Answer by Edwin McCravy(20056)  (Show Source): (Show Source):
You can put this solution on YOUR website!
h(x) = x4 - 2x3 - 6x2 + 8x + 5
y = h(-2) = (-2)4 - 2(-2)3 - 6(-2)2 + 8(2) + 5
y = h(-2) = 16 - 2(8) - 6(4) + 16 + 5
y = h(-2) = 16 - 16 - 24 + 21
y = h(-2) = 0 - 24 + 21
y = h(-2) = -3
Do that also with x = -3,-1, 0, 1, 2, 3, 4
and make this table:
x |y=h(x) point
---------------------
-3 | 62 (-3,62) <-- too high to plot
-2 | -3 (-2,-3)
-1 | -6 (-1,-6)
0 | 5 (0,5)
1 | 6 (1,6)
2 | -3 (2,-3)
3 | 2 (3,2)
4 | 69 (4,69) <-- too high to plot.
Then plot them and draw a smooth curve through them:
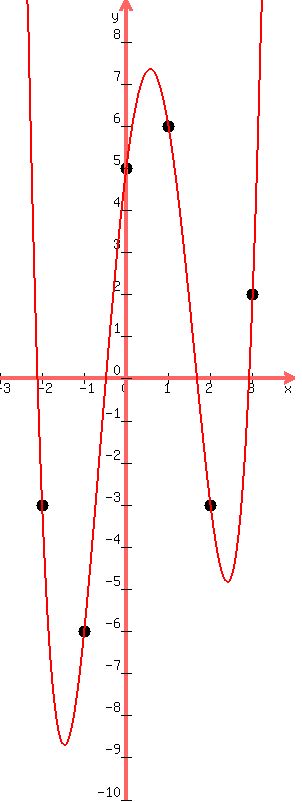 There is a real zero between where x=-3 and where x=-2
because when x is -3, y is 63, a positive number and
when x=-2, y is -3, a negative number. So for the graph
to get from a y-value that is positive a y-value that is
negative, the graph must cross the x-axis between
them.
There is a real zero between where x=-1 and where x=0
because when x is -1, y is -6, a negative number and
when x=0, y is 5, a negative number. So for the graph
to get from a y-value that is negative to a a y-value
that is positive, the graph must cross the x-axis between
them.
There is a real zero between where x=1 and where x=2
because when x is 1, y is 6, a positive number and
when x=2, y is -3, a negative number. So for the graph
to get from a y-value that is positive a y-value that is
negative, the graph must cross the x-axis between
them.
There is a real zero between where x=2 and where x=3
because when x is 2, y is -3, a negative number and
when x=3, y is 2, a positive number. So for the graph
to get from a y-value that is negative a y-value that is
positive, the graph must cross the x-axis between
them.
Looks like the leftmost relative minimum point ("valley") occurs
between where x = -2 and -1.
Looks like the only relative maximum point ("peak") occurs
between where x = 0 and 1.
Looks like the rightmost relative minimum point ("valley") occurs
between where x = 2 and 3.
Edwin
There is a real zero between where x=-3 and where x=-2
because when x is -3, y is 63, a positive number and
when x=-2, y is -3, a negative number. So for the graph
to get from a y-value that is positive a y-value that is
negative, the graph must cross the x-axis between
them.
There is a real zero between where x=-1 and where x=0
because when x is -1, y is -6, a negative number and
when x=0, y is 5, a negative number. So for the graph
to get from a y-value that is negative to a a y-value
that is positive, the graph must cross the x-axis between
them.
There is a real zero between where x=1 and where x=2
because when x is 1, y is 6, a positive number and
when x=2, y is -3, a negative number. So for the graph
to get from a y-value that is positive a y-value that is
negative, the graph must cross the x-axis between
them.
There is a real zero between where x=2 and where x=3
because when x is 2, y is -3, a negative number and
when x=3, y is 2, a positive number. So for the graph
to get from a y-value that is negative a y-value that is
positive, the graph must cross the x-axis between
them.
Looks like the leftmost relative minimum point ("valley") occurs
between where x = -2 and -1.
Looks like the only relative maximum point ("peak") occurs
between where x = 0 and 1.
Looks like the rightmost relative minimum point ("valley") occurs
between where x = 2 and 3.
Edwin
|
|
|