Question 1032332: The life span of brand-A light bulbs is normally distributed with a mean of 800 hours and a standard deviation of 40 hours. The company wishes to advertise that 90% of their light bulbs will last longer than X hours. What is the approximate value of X?
A 734.2
B 878.4
C 721.6
D 851.2
E 748.8
Answer by Theo(13342)   (Show Source): (Show Source):
You can put this solution on YOUR website! The life span of brand-A light bulbs is normally distributed with a mean of 800 hours and a standard deviation of 40 hours. The company wishes to advertise that 90% of their light bulbs will last longer than X hours. What is the approximate value of X?
m = 800 hours
s = 40 hours
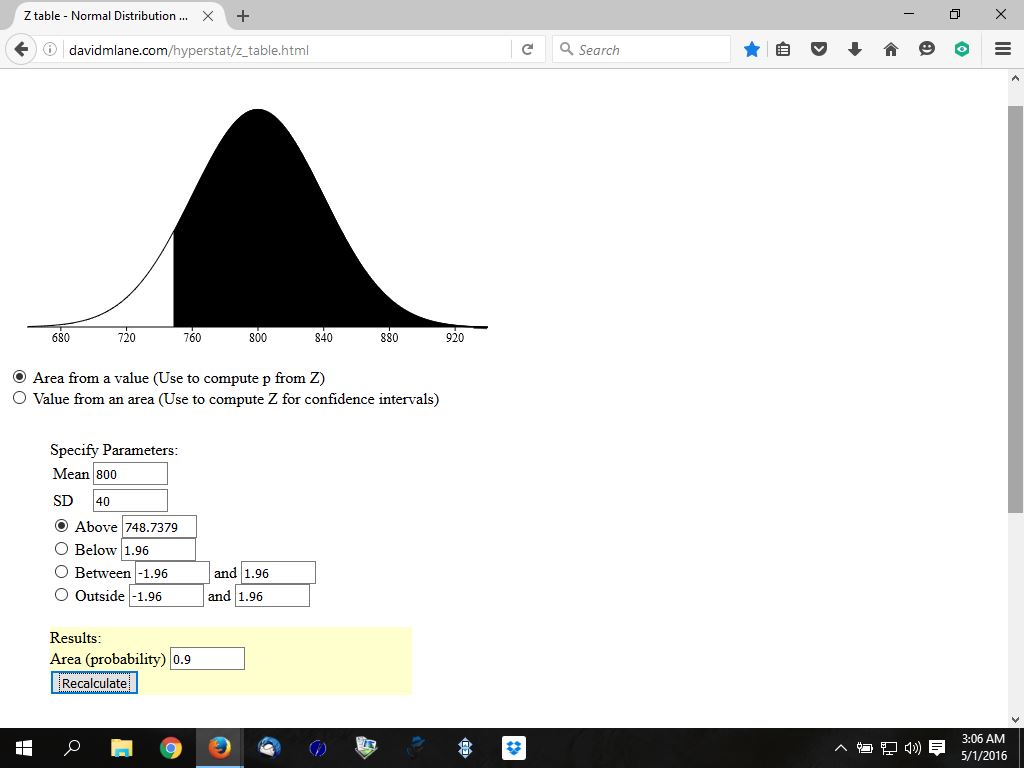
the 10th percentile gives you a z-score of -1.281551567, using a z-score calculator.
this means that 10% of the bulbs would have a life expectancy less than this and 90% of the bulbs would have a life expectancy greater than this.
the formula for z-score is z = (x - m) / s
z is the z-score
x is the raw score
m is the mean
s is the standard deviation
you have z = -1.281551567, x = what you want to find, m = 800, s = 40.
the formula becomes -1.281551567 = (x - 800) / 40.
solve for x to get x = -1.281551567 * 40 + 800 = 748.7379373.
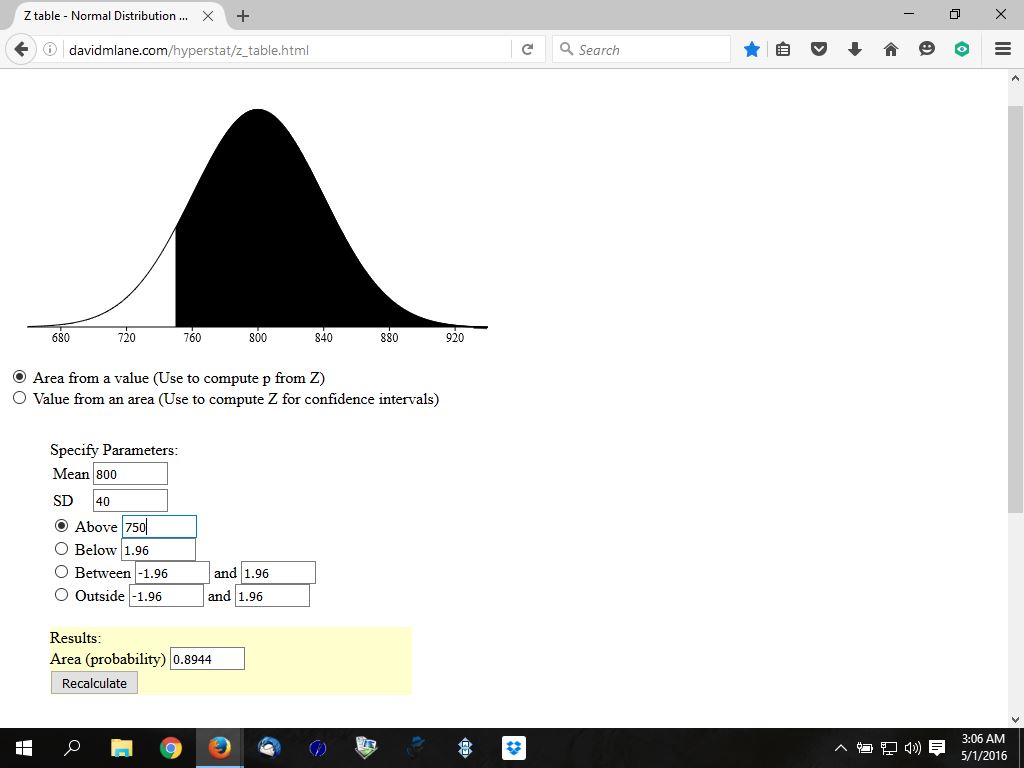
you would probably round this to something like 750 which would be slightly less than 90%, or maybe 745 which would be slightly more than 90% since those are nice round numbers easy to remember.
if you used the z-score table, you would look for a percent to the left of the z-score of either .10 or the next smaller percent closest to .10.
i found .0985 with a z-score of -1.29.
using that z-score, the formula becomes -1.29 = (x-800)/40.
solve for x to get x = -1.29 * 40 + 800 = 748.4.
that's pretty close to 748.7379373, and definitely close enough if you take rounding into account.
the actual numbers, if someone were to do a study, would probably not be exactly any of these numbers anyway.
the z-score table i used can be found here.
http://www.stat.ufl.edu/~athienit/Tables/Ztable.pdf
look up a z-score of -1.29 and you will see that the number shown is .0985.
this mean that 9.85 percent of the z-scores would be to the left of this and 90.15% of the z-scores would be to the right of this. (1 - .0985 = .9015).
to the left means having a z-score less than.
to the right means having a z-score more than.
equate this to raw scores, and to the left means having a raw score less than and to the right means having a raw score greater than.
if you were to look at this on a graphical display of the normal distribution tables, you would proabably see something like as shown below.
the first is at exactly 748.7379373 or as close to that as the software allows.
the second is at 750.
the third is at 745.
if you look at the percentages, you will see that they all hover around the 90% mark.
first is right on.
second is slightly lower.
third is slightly higher.
the black area on the normal distribution curve is the area that contains numbers greater than the number indicated.

|
|
|