Question 1027711: Consider this function g(x) = (c(1-x^2))^1/2 where c is not 0.
A)Graph some of these curves of different negative values of c. Provide sketches for each curve and describe in words what these curves look like for different negative values of c.
B)Graph some of these curves of different positive values of c. Provide sketches for each curve and describe in words what these curves look like for different positive values of c.
Answer by KMST(5328)   (Show Source): (Show Source):
You can put this solution on YOUR website! I do not believe the problem posted involves complex numbers.
I believe  and and  are meant to be real numbers. are meant to be real numbers.
We know that to make  a real number we must have a real number we must have
 , which limits the domain of the function. , which limits the domain of the function.
We also know something about the range of the function.
We know that it will be  through the domain of . through the domain of .
So the graph will be a curve that will always have  , ,
meaning that it will never go below the x-axis,
and there will be a curve only where is in the domain of the function.
IF YOU HAVE BEEN STUDYING CONIC SECTIONS (SUCH AS ELLIPSES AND HYPERBOLAS):
The graph will have  <--> <--> <--> <--> . .
Rearranging we get

and dividing both sides by  we get we get

When  , ,
<--> <--> <-->
is the equation of a hyperbola.
The graph we get (for  only) looks like the ones below. only) looks like the ones below.
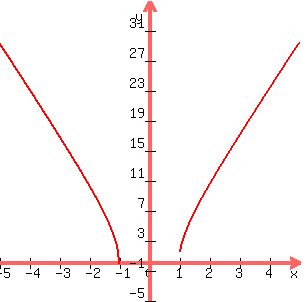 for for  , when , when  <--> <--> , ,
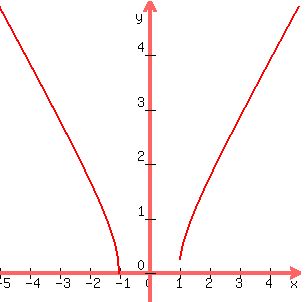 for for  , when , when  <--> <--> , and , and
 for for  , when , when  <--> <--> . .
They all look the same, because they are the same curve stretched vertically to different degrees, but the change in y-axis scale sort of compensates for the stretch.
b) When ,
<-->
is the equation of an ellipse (or circle).
The graph we get (for only) looks like the ones below.
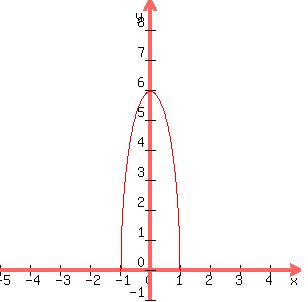 for for  , when , when  is the equation of an ellipse with a vertical major axis and vertices at (0,6) and (0,-6), is the equation of an ellipse with a vertical major axis and vertices at (0,6) and (0,-6),
 for for  , when , when  is the equation of a circle of radius 1, and is the equation of a circle of radius 1, and
 for for  , when , when  is the equation of an ellipse with a horizontal major axis and vertices at (0,1) and (0,-1). is the equation of an ellipse with a horizontal major axis and vertices at (0,1) and (0,-1).
|
|
|