Question 1018514: Consider the logarithmic equation f(x) = ln (x + 2) – 1. Round all values to the tenths place.
(a) Determine any x- and y-intercepts.
(b) Determine the domain and the equation of the vertical asymptote.
(c) Make a table of values to find three other points on the graph.
(d) Graph the function. Label the three points you found in Part (c).
Answer by Theo(13342)   (Show Source): (Show Source):
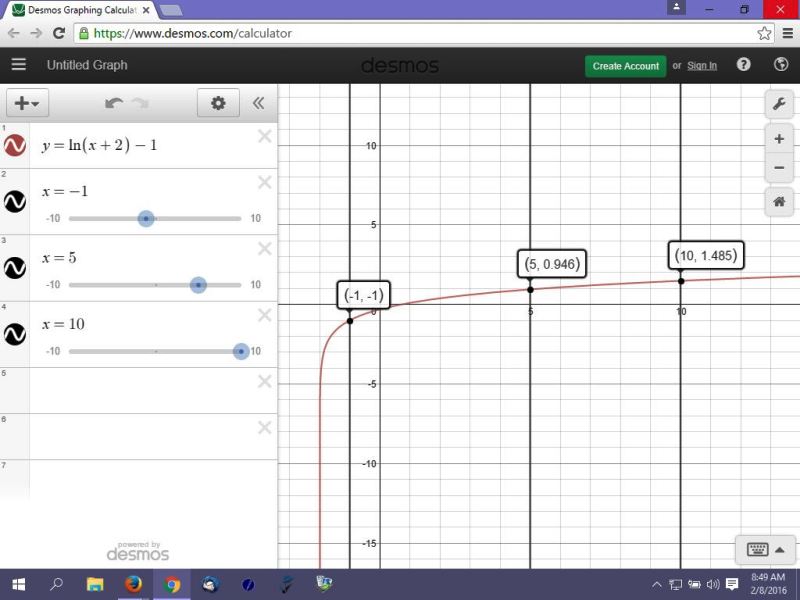
You can put this solution on YOUR website! the graph of the equation of y = ln(x+2) - 1 is shown below.
look below the graph for further comments.

your answers are described below.
Consider the logarithmic equation f(x) = ln (x + 2) – 1. Round all values to the tenths place.
(a) Determine any x- and y-intercepts.
the x-intercept is found by setting y = 0 and solving for x.
y = ln(x+2)-1 becomes 0 = ln(x+2)-1.
add 1 to both sides of this equation to get ln(x+2) = 1
this is true if and only if e^1 = x+2
solve for x to get x = .71828.....
the y-intercept is found by setting x = 0 and solving for y.
y = ln(x+2)-1 becomes y = ln(2)-1.
solve for y to get y = .30685...
these are rounded to 3 decimal places on the graph.
the vertical asymptote is found when the argument inside the equation of y = ln(x+2) - 1 is set to 0.
this occurs when x = -2 because -2 + 2 = 0.
any value of x less than or equal to -2 will be undefined.
any value of x greater than -2 will be defined.
as the value of x gets closer to 0 from the right, the value of y will get progressively larger in a negative direction.
so the value of y approaches negative infinity as x gets closer and closer to -2 from the right.
that's your vertical asymptote.
the function will get progressively larger as x becomes larger going in a positive direction.
there does not appear to be any limit to how high the value of y gets as far as i can see, although it does get up there very slowly.
for example, when x = 9 * 10^99, y = 229.15.
my calculator can't go higher than that, but it appears that there is no limit to the value of y, although the value of y increases extremely slowly in relation to x.
the value of y does not get closer and closer to a limit value, but just keeps getting higher and higher.
therefore, no horizontal asymptote as far as i can determine.
(b) Determine the domain and the equation of the vertical asymptote.
the domain is all real values of x > -2.
the range is all real values of y.
(c) Make a table of values to find three other points on the graph.
this is easy enough for you to do.
simply choose some values of x and then solve the equation for y.
use your calculator to find three other values of x and then solve for y using your scientific calculator or an online scientific calculator if you don't have one.
the equation is y = ln(x+2) - 1
you already have the value of y when x = -2 (it's minus infinity), and when x = 0 (it's -.30685...).
(d) Graph the function. Label the three points you found in Part (c).
i did it for you.
the three points i chose are shown in the following graph.
using the desmos calculator, it's a simple matter of setting x equal to the values that you chose and then finding the intersection, which the desmos calculator will show you.
the desmos calculator does round to 2 or 3 decimal places, so if you want better accuracy, then perform the calculations in your scientific calculator.
here's the graph.
|
|
|