Question 1018252: How would I graph the solution set of the system of inequalities or indicate that the system has no solution
8x+6y>6
2x+y<8
Answer by KMST(5328)   (Show Source): (Show Source):
You can put this solution on YOUR website! Graphing one linear equation, or one inequality can be tough.
You start by deciding on the scale to be used for the x-axis and the y-axis.
You may start with -10 to 10 on both axes, and see how it looks.
If it does not look good, you may have to re-do the graph.
When you have two inequalities, it can be torture,
because the scale that makes each graph look good for one inequality
may not look good for the two of them together.
Thinking and planning ahead may save time and pain,
and may allow to skip up to the solution of the system of inequalities,
without having to graph each inequality separately first.
The graph for any linear inequality has one solid or dashed boundary line,
and the region of the x-y plane to one side of that line, colored or shaded.
(The boundary line is dashed when the inequality sign is  or or  , and it is solid if the sign includes an "or equal"). , and it is solid if the sign includes an "or equal").
A system of linear inequalities can have boundary lines that intersect. In that case, the graph of the solution is one of the four angles formed by those boundary lines (colored or shaded), with the boundary rays dashed or solid, depending on the inequality sign.
The graph of the solution to  will consist of two dashed rays (portions of the dashed boundary lines for each inequality), will consist of two dashed rays (portions of the dashed boundary lines for each inequality),
with a colored or shaded angle between them.
Unfortunately for you, the two lines intersect at a point quite far from the origin,
and since your graph needs to show the x- and y-axes, it needs to show the origin.
Showing the origin and the intersection between the two lines makes for an ugly graph,
with a weird scale, but that is what was asked for.
Feel free to use a different scale.
The lines intersect at
 --> -->
I will leave the original lines showing as faint green traces
(they are not part of the solution, and could be erased).
To draw those lines, you can use the intersection point, along with points (0,1) and (4,0).
I will draw the solution as black dashed boundary lines,
and I will fill with red-line shading the angle region that is the solution.
 The point (2,0) in the angle shaded can be used as a check point to verify the solution. The point (2,0) in the angle shaded can be used as a check point to verify the solution.
FOR REFERENCE, THIS IS HOW THE INDIVIDUAL INEQUALITIES WOULD BE GRAPHED:
The inequality  represents all the point in the x-y coordinate plane to one side of the line given by represents all the point in the x-y coordinate plane to one side of the line given by  , not including the boundary line. , not including the boundary line.
To graph that inequality, you would graph the boundary line as a dashed line,
and you would color or shade the side that represents .
To graph a line, you need two points.
In the case of , the points that seem easiest to find are those with  or or  . .
For ,  --> --> --> --> gives us point gives us point  . .
For ,  --> --> --> --> --> --> gives us point gives us point  . .
To graph the line you locate points  and and  an d draw the line that connects them. an d draw the line that connects them.
 . .
The inequality is graphed as  , with the line dashed, , with the line dashed,
and the side containing the origin colored,
because (0,0) , with  is one point of the solution to : is one point of the solution to :
 . .
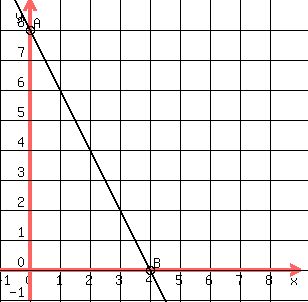
The inequality  represents all the point in the x-y coordinate plane to one side of the line given by represents all the point in the x-y coordinate plane to one side of the line given by  , not including the boundary line. , not including the boundary line.
To graph that inequality, you would graph the boundary line as a dashed line,
and you would color or shade the side that represents .
In the case of , the points with or are easy to find, but are too close to each other to help you draw the line.
You can use --> --> --> --> --> --> --> --> --> , ,
which gives us point  , ,
but --> --> --> --> --> --> --> --> --> gives us point gives us point  , ,
which is so close to  that you cannot draw a good line. that you cannot draw a good line.
Instead, for  , ,
 --> --> --> --> --> --> --> --> --> --> gives us gives us  . .
So you would graph the line as
 , and the inequality } as , and the inequality } as  , ,
with the colored part not including the origin,
because (0,0) , with is not part of the solution to :
 . .
|
|
|