Question 1006758: Graph f(x)=log(base 2)(x+3).Label the asymptote with a dotted line.You must plot at least 3 points and show work for how you got them.
Answer by Theo(13342)   (Show Source): (Show Source):
You can put this solution on YOUR website! your equation is f(x) = log(2,x+3).
that means log of x+3 to the base of 2.
let y = f(x) and the equation becomes y = log(2,x+3).
this is true if and only if 2^y = x + 3.
solve this equation for x and you get x = 2^y - 3.
to manually graph this equation without resorting logs using your calculator, you would pick 3 random values for y and then solve for x.
i will choose y = 1, 3, 5.
when y = 1, x = 2^1 - 3 = 2 - 3 = -1.
when y = 3, x = 2^3 - 3 = 8 - 3 = 5.
when y = 5, x = 2^5 - 3 = 32 - 3 = 29.
the coordinates you would graph are (-1,1), (5,3), (29,5)
if you need more points, you sould just plot more points.
space them out so you get a good idea of the overall shape of the graph.
if you look at the equation of x = 2^y - 3, you will see that as y becomes a very large negative number, the value of 2^y gets very close to 0 and so the value of x gets very close to -3.
the value of x will never get less than -3, so you have a vertical asymptote at x = -3.
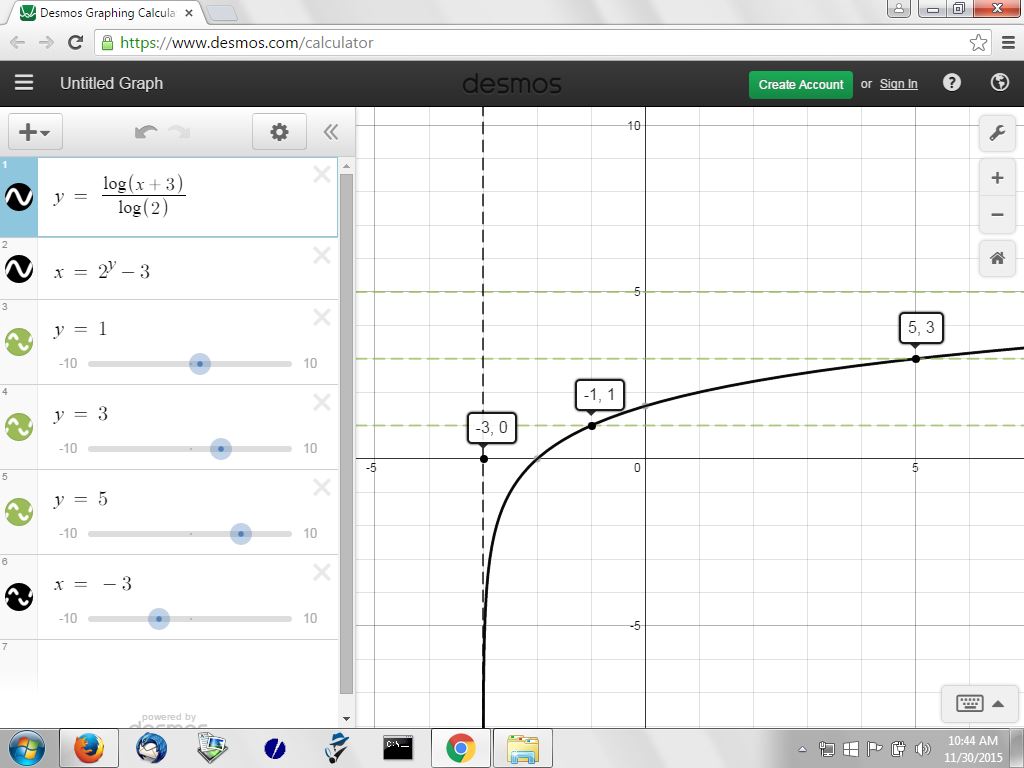
the grpah of the log equation is shown below:
superimposed on that is the graph of the exponential equation.
they are identical, as they should be.
i plotted the essential points so you can visually see what i calculated above.
i also put a dashed line where the vertical asymptote is.
there are 2 graphs below.
the first is scaled so you can see the vertical asymptote and the points of (-1,1) and (5,3).
the second is scaled soyou can see the point (29,5).
to plot the points manually, you use the exponential form of the equation and select values for y and then solve for corresponding values of x.
the log form of the equation and the exponential form of the equation are both shown.
they both result in the same identical curved line on the graph.
the exponential form is equivalent to the log form.
it's based on the basic definition of logs that states that:
log(b,x) = y if and only if b^y = x.
in your case, b was equal to 2 and x was equal to (x + 3).
the equation became:
log(x,x+3) = y if and only if 2^y = x+3.
solve for x to get x = 2^y - 3.

|
|
|