Advanced GraphingThe following text is for those interested in more complex graphing techniques, and therefore assumes a higher level of understanding of mathematics. Click here to go back to the easier part of the lesson. The point of graphing is to express the essential nature of the function in a visual form. Where graphing helps is that it gives you an ability to "see" functions in your head without even touching paper, if you practice enough. I can do that with most common functions. What we'll discuss here is determining that essential nature and translating it into paper.
Determine the domain of the functionWhile the simplest of functions, such as the linear functions and the quadratic functions, are defined for all values of x, the more complicated functions may be defined only with some subregion of the x axis.
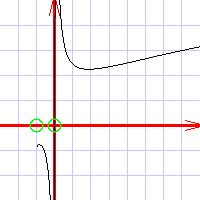
So, for any equation, you first need to find all values of x where the equation has a value. These values are called a domain of the function. Some hints: if your function involves a division operation, exclude all values of x which result in division by zero. If your function involves a square root or logarithm, exclude all values of x which result in the argument to square root or to logarithm being negative. This covers most of the domain restrictions, although there can be many more.
Again, do not attempt to plot the function where it is not defined. This is a major mistake. Determine the special points of the functionThe special points of any function include:
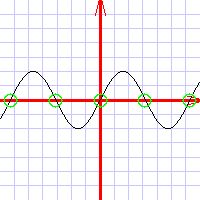
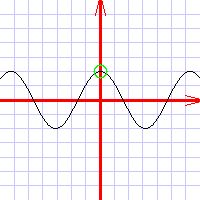
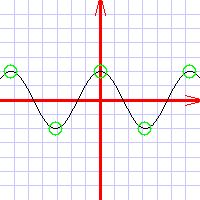
Set up the coordinate system around the special pointsThe special points are what makes the function interesting. So you want to make sure that for your coordinates, you have chosen a big enough area to include at least the best of them. For most functions you would be able to include all special points (except, obviously, for infinity). For some functions called periodic, however, there is an infinite number of special points. A case in point is the 2sin(x) function above: it waves around the x axis endlessly. For such functions, what you want to do is include a few special points so that their nature would become evident. This part of your job is mostly about not dong stupid things. One of these stupid things would be to set up your coordinates so that the graph of the function lies wholly outside your drawing. Plot these special points using circles of X symbolsShall I say more? :)Determine slopes and curvaturesAnalyze the function and find out where it is sloping upwards, where it is sloping downwards, where it is concave, and where it is convex. Sloping upwards Sloping downwards Concave function Convex function Plot some more points around the special pointsAfter all this work, all you need is to just plot a few more points, and the curve will emerge all by itself. Just pick a few points with some reasonable interval, use your calculator, and plot these points. Draw the lineDraw the line through the points, little by little. 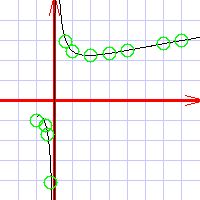 | |||||||||||||||||||||||||

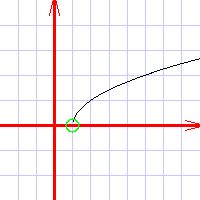
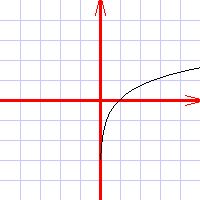
 : it is
not defined for x < 0, because square root of a negative value
does not exist. (strictly speaking, the square root of
negative values is a complex number, which you will study
later.)
: it is
not defined for x < 0, because square root of a negative value
does not exist. (strictly speaking, the square root of
negative values is a complex number, which you will study
later.)