Question 150836This question is from textbook a survey of mathematics with applications
: can i please get help?
Select five random numbers between 30 and 100. Calculate the mean, median, mode, and midrange of these numbers. Based on your calculations, which measure of central tendency best represents these numbers?
This question is from textbook a survey of mathematics with applications
Answer by Fombitz(32388)   (Show Source): (Show Source):
You can put this solution on YOUR website! I used EXCEL to calculate 5 random numbers.
They are (95,31,42,71,47) or (31,42,47,71,95) ordered from smallest to largest.
Mean : 
Median : 3rd number ranked smallest to largest : 
Mode : Each number only occurs only once. No additional information gained from the mode.
Midrange : (1/2)(Min+Max)=
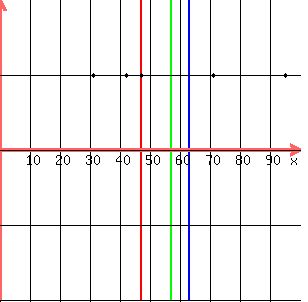
Shown on the graph are the mean(green line), the median(red line), and the midrange(blue line) along with the 5 data points.
Looks like the median estimates too low, the midrange estimates too high, which leaves the mean as the best measure in this case.
This happened because there were two data points close to each other (42,47).
|
|
|