Question 1091512: A group of wholesalers will buy 50 dryers per month if the price is R200 and 30 per month if the price is
R300. The manufacturer is willing to supply 20 if the price is R210 and 30 if the price is R230. Assuming
that the resulting supply and demand functions are linear.
Find the equilibrium point for the market.
Answer by Theo(13342)   (Show Source): (Show Source):
You can put this solution on YOUR website! the two points of your demand equation are:
(200,50) and (300,30)
price is on the x-axis and number of units demanded is on the y-=axis.
use these points to find the slope equal to (30-50) / (300 - 200) = -20 / 100 = -1/5.
use any one of these points to find the y-intercept.
i used the point (200,50) to get y = -1/5 * x + b becomes 50 = -1/5 * 200 + b.
solve for b to get b = 50 + 40 = 90
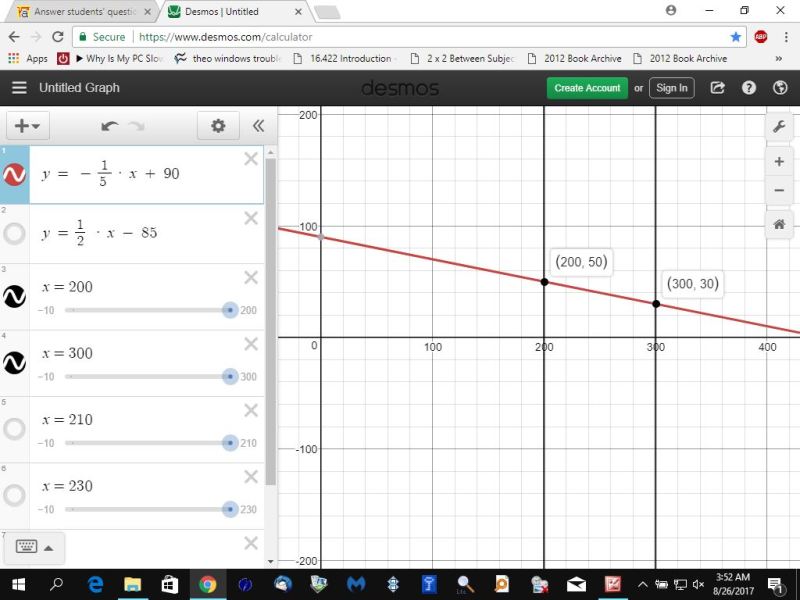
the demand equation becomes y = -1/5 * x + 90
the two points of your supply equation are:
(210,20) and (230,30)
use these points to find the slope equal to (30 - 20) / (230 - 210) which is equal to 10 / 20 which is equal to 1/2.
use any one of these points to find the y-intercept.
i used (210,20) to get y = 1/2 * x + b becomes 20 = .5 * 210 + b.
this reqults in 20 = 105 + b.
solve for b to get b = 20 - 105 which is equal to -85.
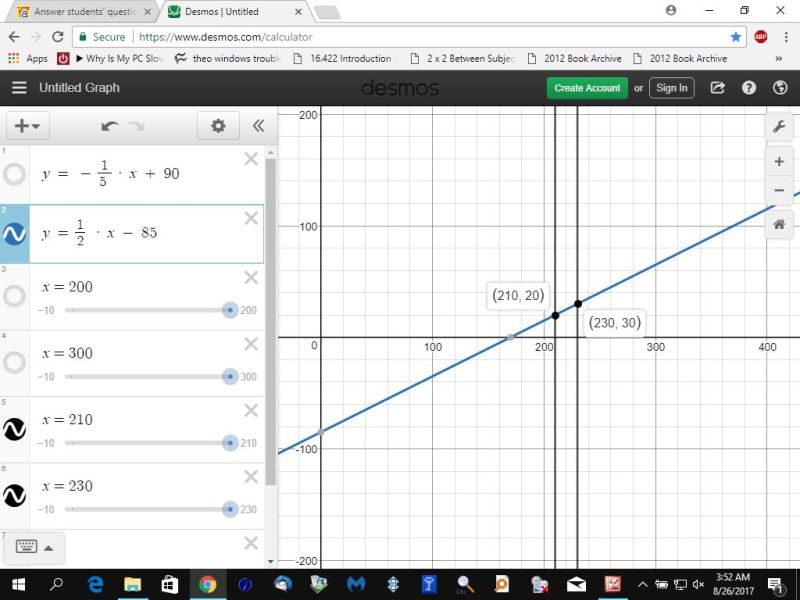
your supply equation is y = 1/2 * x - 85
the graph of your demand equation is shown below.
you can see that when the price is 200, the demand is 50 units.
you can also see that when the price is 300, the demand is 30 units.
the graph of your supply equation is shown below.
you can see that when the price is 210, the supply is 20.
you can also see that when the price is 230, the supply is 30.
the graph of your equilibrium point is shown below.
you can see that the demand and the supply are equal when the price is 250.
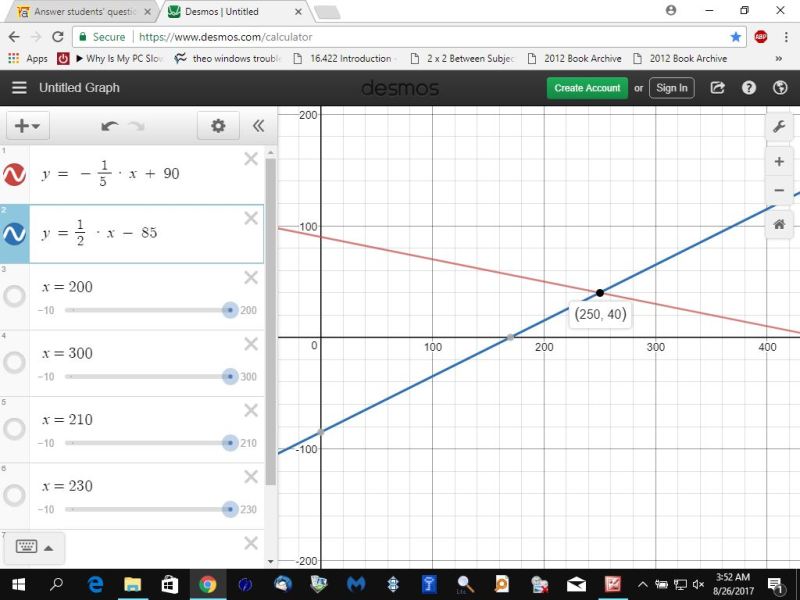
when the price is 250, the demand equation of y = -1/5 * x + 90 becomes y = -1/5 * 250 + 90 which becomes y = -50 + 90 which becomes y = 40.
when the price is 250, the supply equation of y = 1/2 * x - 85 becomes y = 1/2 * 250 - 85 which becomes y = 125 - 85 which becomes y = 40.
that's your equilibrium point which is when the demand equals the supply.
the slope intercept format of the equaiton of a straight line is:
y = mx + b
m is the slope.
b is the y-intercept.
the formula to find the slope is m = (y2-y1) / (x2-x1).
(x1,y1) and (x2,y2) are any two points on the line.
once you find the slope, you find the y-intercept by taking any one of the two points given and replacing y with the y value of that point and x with the x value of that point and then solving for b.
this is what i did above.
|
|
|