Question 87272: A small firm produces both AM and AM/FM car radios. The AM radios take 15h to produce, and the AM/FM radios take 20h. The number of production hours is limited to 300h per week. The plant's capacity is limited to a total of 18 radios per week, and existing orders require that at least 4 AM radios and at least 3 AM/FM radios be produced per week. Write a system of inequalities representing this situation. Then, draw a graph of the feasible region given these conditions, in which x is the number of AM radios and y the number of AM/FM radios
Found 2 solutions by favegirl13, jim_thompson5910:
Answer by favegirl13(22)   (Show Source): (Show Source):
You can put this solution on YOUR website! The systems of inequalities: (x represents # AM radios & y represents # AM/FM radios)
use four different colored pencils for shading so determining the feasible will be easy
1)
15x+20y<300
-15x -15x
20y<300-15x
everything over 20
y<15-3/4x or y<-3/4x+15
graph this start (15,0) then go down 3 and to the right 3 each time.
connect the points.
shade the area below the line
2)x>4
place the point (4,0) and draw a vertical line through the point.
shade the right area of the vertical
3)y>3
place the point (0,3) and draw a horizontal line through the point.
shade on top of the horizontal.
4)
4x+3y<18
-4x -4x
3y<18-4x
everything over 3
y<6-4/3x or y<-4/3x+6
place the point (6,0) then go down 4 then to the right each time
connect the dots then shade the area below the line.
FINALLY:
the part of the graph where all the shaded regions overlap is the feasible region.
HOPE YOU UNDERSTAND
Answer by jim_thompson5910(35256) (Show Source): (Show Source):
You can put this solution on YOUR website! Since the total production hours are limited to 300 hours, this inequality would apply:
The idea of this inequality is if we plug in values for x and y, we must stay under 300 (since its limited to 300 hrs a week)
For instance, lets say we produced 2 AM radios and 4 AM/FM radios, we could find out if we met the restrictions by plugging them in like this
 -> -> -> ->
So to produce these units, we stay within 300 hrs
Also, since the total number of radios produced is limited to 18, this means this inequality would apply:
 basically the sum of all that is produced must be less than 18 units basically the sum of all that is produced must be less than 18 units
Also, since you cannot produce negative units, it makes sense to restrict x and y to positive numbers only. So these inequalities would do just that:
 Inequality for positive x values Inequality for positive x values
Inequality for positive y values
So basically we need to graph this system of inequalities:

So now lets graph this system of inequalities:
Start with the given system of inequalities
In order to graph this system of inequalities, we need to graph each inequality one at a time.
First lets graph the first inequality
In order to graph , we need to graph the equation  (just replace the inequality sign with an equal sign). (just replace the inequality sign with an equal sign).
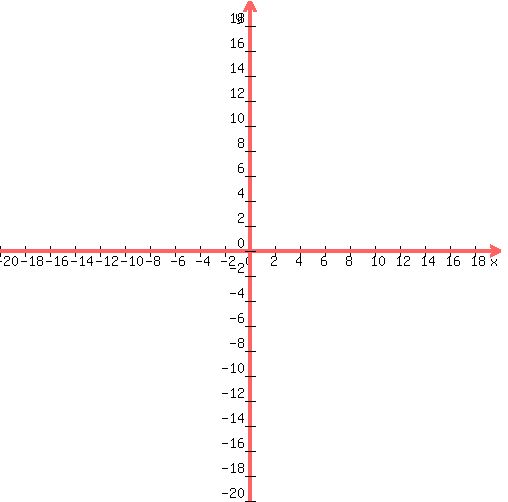
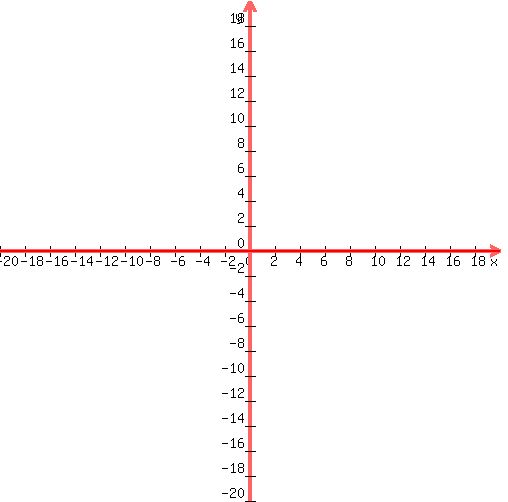
So lets graph the line (note: if you need help with graphing, check out this solver)
 graph of graph of
Now lets pick a test point, say (0,0) (any point will work, but this point is the easiest to work with), and evaluate the inequality
Substitute (0,0) into the inequality
 Plug in Plug in  and and 
 Simplify Simplify
Since this inequality is true, we simply shade the entire region that contains (0,0) (note: even though the shaded region looks like it's a fixed size, it is a region with an area of infinite size. The reason it looks like it stops is due to the graphing limitations of this site. But in reality, the shaded region occupies the whole area on one side of the red line.)
 Graph of with the boundary (which is the line in red) and the shaded region (in green) Graph of with the boundary (which is the line in red) and the shaded region (in green)
(note: since the inequality contains a less-than sign, this means the boundary is excluded. This means the solid line is really a dashed line)
---------------------------------------------------------------
Now lets graph the second inequality
In order to graph , we need to graph the equation  (just replace the inequality sign with an equal sign). (just replace the inequality sign with an equal sign).
So lets graph the line (note: if you need help with graphing, check out this solver)
 graph of graph of
Now lets pick a test point, say (0,0) (any point will work, but this point is the easiest to work with), and evaluate the inequality
Substitute (0,0) into the inequality
 Plug in and Plug in and
 Simplify Simplify
Since this inequality is true, we simply shade the entire region that contains (0,0)
 Graph of with the boundary (which is the line in red) and the shaded region (in green) Graph of with the boundary (which is the line in red) and the shaded region (in green)
(note: since the inequality contains a less-than sign, this means the boundary is excluded. This means the solid line is really a dashed line)
---------------------------------------------------------------
Now lets graph the third inequality
In order to graph , we need to graph the equation (just replace the inequality sign with an equal sign).
So lets graph the line (note: if you need help with graphing, check out this solver)
 graph of (note:the graph is the line that is overlapping the y-axis. So it may be hard to see) graph of (note:the graph is the line that is overlapping the y-axis. So it may be hard to see)
Now lets pick a test point, say (0,0) (any point will work, but this point is the easiest to work with), and evaluate the inequality
Substitute (0,0) into the inequality
 Plug in and Plug in and
 Simplify Simplify
Since this inequality is true, we simply shade the entire region that contains (0,0)
 Graph of with the boundary (which is the line in red) and the shaded region (in green) Graph of with the boundary (which is the line in red) and the shaded region (in green)
(note: since the inequality contains a less-than sign, this means the boundary is excluded. This means the solid line is really a dashed line)
---------------------------------------------------------------
Now lets graph the fourth inequality
In order to graph , we need to graph the equation (just replace the inequality sign with an equal sign).
So lets graph the line (note: if you need help with graphing, check out this solver)
 graph of (note:the graph is the line that is overlapping the x-axis. So it may be hard to see) graph of (note:the graph is the line that is overlapping the x-axis. So it may be hard to see)
Now lets pick a test point, say (0,0) (any point will work, but this point is the easiest to work with), and evaluate the inequality
Substitute (0,0) into the inequality
Plug in and
Simplify
Since this inequality is true, we simply shade the entire region that contains (0,0)
 Graph of with the boundary (which is the line in red) and the shaded region (in green) Graph of with the boundary (which is the line in red) and the shaded region (in green)
(note: since the inequality contains a less-than sign, this means the boundary is excluded. This means the solid line is really a dashed line)
---------------------------------------------------------------
So we essentially have these 4 regions:
Region #1
 Graph of Graph of
Region #2
 Graph of Graph of
Region #3
 Graph of Graph of
Region #4
 Graph of Graph of
When these inequalities are graphed on the same coordinate system, the regions overlap to produce this region. It's a little hard to see, but after evenly shading each region, the intersecting region will be the most shaded in.

Here is a cleaner look at the intersection of regions
 Here is the intersection of the 4 regions represented by the series of dots Here is the intersection of the 4 regions represented by the series of dots
Anywhere in this combined shaded region represents a point (x,y) which represents the number of AM and AM/FM radios that need to be produced to stay within the restrictions.
|
|
|