Question 476107: how do you graph y=(-1/3)(x+1)(x-5)
Answer by bucky(2189)   (Show Source): (Show Source):
You can put this solution on YOUR website! If you look carefully at this problem, you can learn a lot about the general shape of this graph.
.
Notice that by multiplying the two factors together [(x+1)*(x-5)] you get a quadratic equation because you will have an x-squared term, an x-term, and a constant. You probably know that a quadratic equation graphs out as a parabola.
.
Next, you can tell at what points the graph crosses the x-axis. How can you tell? Think about this: what is the value of y for points on the x-axis. y is zero for all points on the x-axis.
.
Next, think about this: When will y = 0 in the equation that you were given? It will be zero if either of the two factors (the two factors are (x + 1) and (x - 5)) are equal to zero. If a factor is equal to zero, then the right side has a multiplier of zero so the entire right side goes to zero and y on the left side will equal the right side value of zero. Look first at the factor (x + 1). When will it equal zero? That will happen if the value of x = -1 because -1 + 1 = 0. So on your graph paper, put a dot on the x-axis at x = -1.
.
Similarly, the other factor (x - 5) will be zero if x = +5. So put a dot on the x-axis at the point x = +5.
.
As you move from left to right on the graph it either drops down to a minimum point and then moving further to the right it rises ... much the same appearance as the path of a skateboarder who comes down a sloped wall to the bottom and then coasts up the opposite wall. Or the path of a snowboarder going from one side of the tube to the other by crossing the bottom.
.
Or you have an alternate possibility. The graph can rise as you go from left to right until it reaches a peak, and then as you continue further to the right it begins to drop. Think of the path of a basketball shot. The ball rises from the shooter's hand, reaches a peak, and then drops back down toward the basket.
.
In any case you can tell which of these two general shapes the quadratic equation gives by looking at the sign of the x-squared term. If the sign is positive, then the graph falls to a minimum point and then rises as you continue to the right. However, if the sign of the x-squared term is negative, then the parabola rises to a peak and then drops back down as you go further to the right.
.
Notice that in this problem the sign on the x-squared term is negative due to the negative sign on the (-1/3) term. It multiplies the x-squared term giving it a minus sign.
.
This being the case, we know that we have a parabola that rises through the left hand point where it crosses the x-axis (at x = -1) rises to a maximum value, and then drops off to cross the x-axis again at x = +5. And it continues going further down as you move further to the right.
.
At what value of x does the peak of the graph occur? It occurs at the point that is midway between the two crossing points on the x-axis. The crossing points are 6 units apart (from -1 to +5 on the x-axis is 6 numbers). The half way point will, therefore, be 3 numbers up from -1 or 3 numbers down from +5. In either case the mid point occurs at x = +2. This means that the peak value of y will occur when x = +2. Substitute +2 for x in the given equation and you get:
.
y = (-1/3)*(x + 1)*(x - 5) which becomes y = (-1/3)*(+2 + 1)*(+2 - 5)
.
This simplifies to:
.
y = (-1/3)*(3)*(-3) = (-1/3)*(-9) = -9/-3 = +3
.
So the peak occurs at the point (+2, +3)
.
You now have enough information to make an approximate graph for the equation:
.
y = (-1/3)*(x + 1)*(x - 5)
.
You can get one more point pretty quickly. Try letting x = 0 and you will find that the value of y (because x equals 0 this will be the y-axis intercept) is +5/3.
.
Now that we've done a quick analysis to give us a rough idea of what the graph looks like, here's a more detailed look:
.
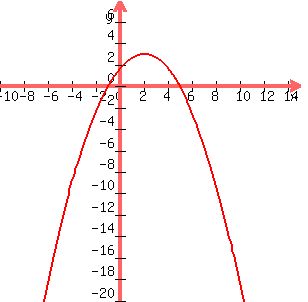
.
Hope this helps you to understand an analytic approach that will aid you in sketching graphs of parabolas.
|
|
|