Question 593780: Please help me solve this questions.=)
QUESTION 1
Let p1 denote the proportion of people who were unemployed in March, and let p2 denote the proportion of people who were unemployed in April. Suppose that during late March, the government instituted policies designed to lower the unemployment rate. We want to test whether the policies were effective. In March, in a random sample of 1200 people, 75 were unemployed. During April, in an independent random sample of 1100 people, 65 were unemployed. Carry out the appropriate hypothesis test using a 3.5% level of significance.
QUSTION 2
Susan is a sales manager of a fast food company with 100 branches. The company�s sales target for each branch in March is at least RM 500 (in thousands). From a sample of 36 branches, the average sale in March is RM 485 (in thousands) with standard deviation of RM 32.4 (in thousands).
a. Can Susan infer that the company�s sales target has been met for March at 5% significance level?
b. Susan and her team introduced a new sales strategy in April to increase the sales in each branch. The total expenses of new strategy for each branch are RM 20 (in thousands). From a new sample of 21 branches, the average sale in April is RM 514 (in thousands) with standard deviation of RM 12.1 (in thousands). Is there enough evidence to say that the new strategy introduced in April is effective and profitable to the company at 5% significance level?
c. Based on the results in (b), what type of error could possibly occur? Explain the effect of this error to the fast food company.
QUESTION 3
For a certain year a study reports that the percentage of college students using credit cards was 83%. A college dean of student services feels that this is too high for her university, so she randomly selects 50 students and finds that 40 of them use credit cards. At α = 0.04, is she correct about her university?
QUESTION 4
A magazine article stated that the average age of women who are getting married for the first time is at most 26 years. A researcher decided to test this hypothesis at 2.5% significance level. She selected a sample of 25 women who were recently married for the first time and found the average was 25.1 years. The standard deviation was 3 years. Is the claim true?
QUESTION 5
A composition teacher wishes to see whether a new grammar program will reduce the number of grammatical errors her students make when writing a two-page essay. The data are shown here. At α = 0.01, can it be concluded that the number of errors has been reduced?
Errors before
12 9 0 5 4 3
Errors after
9 6 1 3 2 3
thank you,=)
Answer by Sarpi(32)   (Show Source): (Show Source):
You can put this solution on YOUR website! Question 1:
March: P1 = prop. of unemployment = 75/1200 ; n = 1200, # unemployed = 75
April: P2 = prop. of unemployment = 65/1100 ; m = 1100, # unemployed = 65
P = P2 -P1 � z α/2 
P = (65/1100) - (75/1200) � z 3.5/2 * 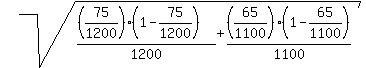
P = -0.0034 � invnorm (0.9825) * 0.009968592
P = -0.0034 � 2.108358398 * 0.009968592
P = -0.0034 - 2.108358398 * 0.009968592 = -0.024417365 lower bound
P = -0.0034 + 2.108358398 * 0.009968592 = 0.017617365 upper bound
the range is from -0.024 to 0.0176. Therefore since 0 is within this range, it can be assumed that the policy of reducing unemployment is less effective because the proportion of unemployment in April should have been smaller than that of March. Statistically, H0: P2 - P1 < 0.
|
|
|