Question 1157392: Estimate the area under the graph of f(x) = 1/x from x = 1 to x = 2 using four approximating rectangles and right endpoints. Sketch the graph and the rectangles. Is your estimate an underestimate or an overestimate?
Answer by KMST(5433)   (Show Source): (Show Source):
You can put this solution on YOUR website! This is a graph of  that gives you the shape of the function that gives you the shape of the function  : :
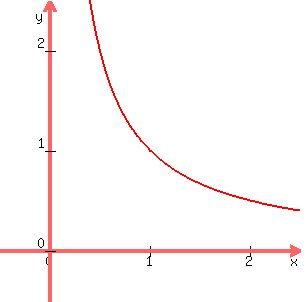
I would like to focus more closely on the interval [1,2], and divide it into four equal intervals.
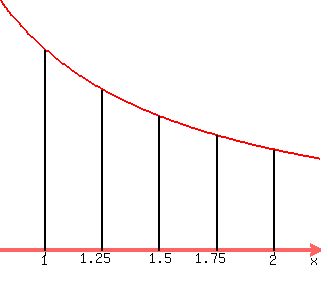
The "area under the curve" (area under the graph) is the area bordered by
the line at x=1,
the line at x=2,
the curve representing the function, and
the x-axis.
We are asked to approximate this area by using four approximating rectangles and right endpoints.
There is no mention of the four x-coordinate intervals being of equal length,
but it is usual procedure, makes calculations easier,
and maybe it was shown as that in an example shown in class.
This is what the graph with four equally wide approximating rectangles:
 The length of the base of each rectangles was The length of the base of each rectangles was  by design, by design,
to make them equally wide.
The heights of the rectangles are;
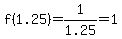 , ,
 , ,
 , and , and
 . .
Using the approxinate value above, the sum of the areas of the rectangles is

That is obviously an underestimate, because
the graph is above the top of the rectangles for all values in [1,2] except 1.25,1,5,1.75, and 2.
| |
|
