Question 1068578: Two linear functions have the same rate of change and the same initial value. What do you know about the graph of the two lines? Explain.
Thanks! Please be detailed!
Answer by Theo(13342)   (Show Source): (Show Source):
You can put this solution on YOUR website! if they have the same rate of change and the same initial value, then they are identical.
same rate of change means they have the same slope.
linear equations that have the same slope are either parallel or identical.
if they have a different y-intercept, they will be parallel, meaning that they will never intersect.
if they do intersect, and they have the same slope, then they have to be identical.
if they are identical, then they will intersect at all values of x.
if they intersect, they are either identical or not parallel.
if they are not parallel, they will have different slopes.
therefore, if they intersect and have the same slopes, they have to be identical, and they have to intersect at all values of x.
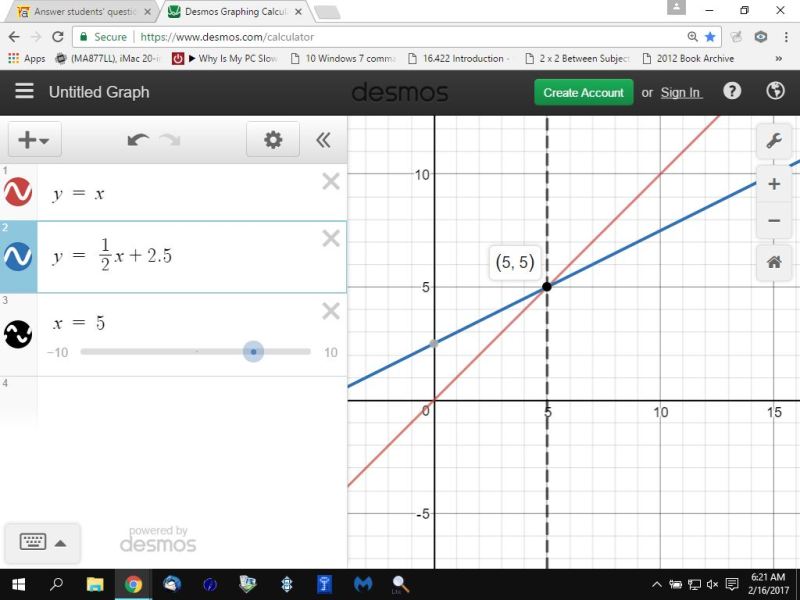
here's a graph of 2 lines that intersect but have different slopes.
they intersect at the point (5,5) but have different slopes.
they will only intersect in one point, that point being (5,5).
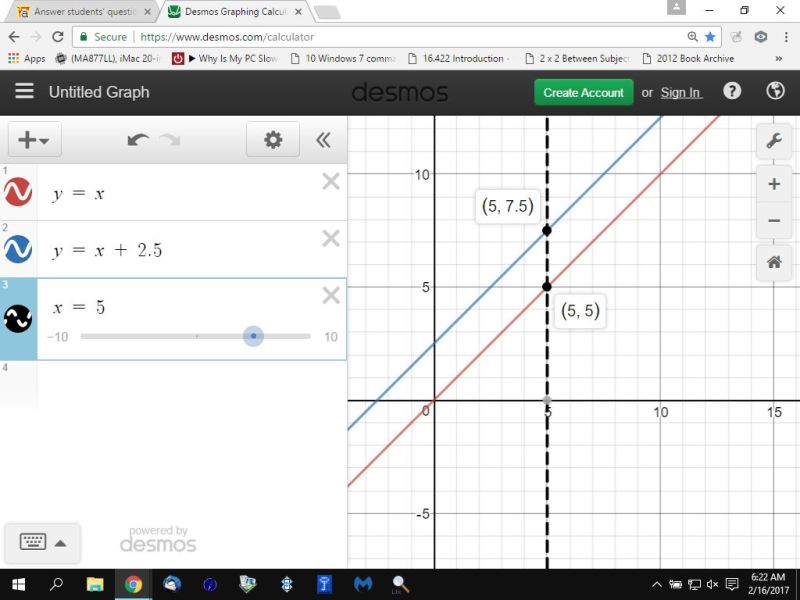
here's a graph of 2 lines that have the same slope but never intersect.
they never intersect because they have the same slope but a different y-intercept.
the first equation has a y-intercept of 0.
the second equation has a y-intercept of 2.5
since they are parallel, they can never intersect.
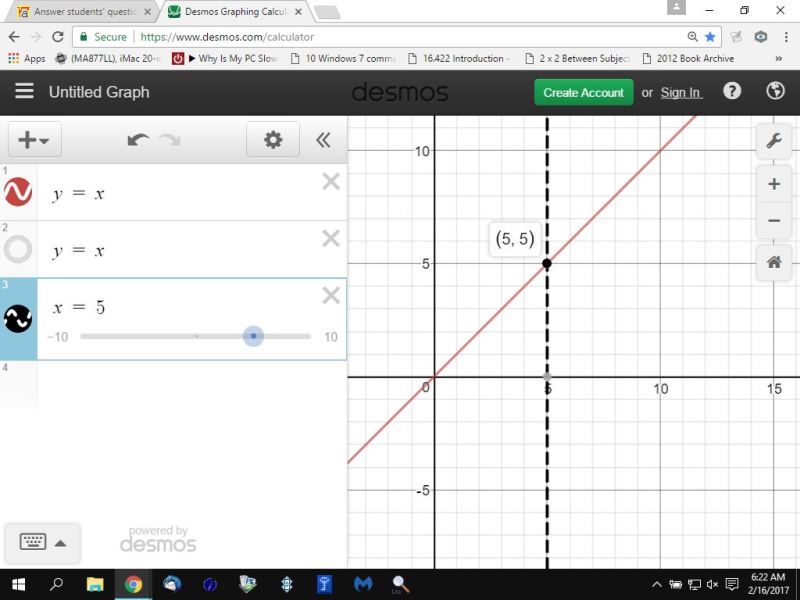
here's the same 2 lines that have the same slope and intersect at the point (5,5).
they can only do that if they have the same slope and the same y-intercept.
the two equations are identical.
they are y = x
the y-intercept is equal to 0 in both equations.+
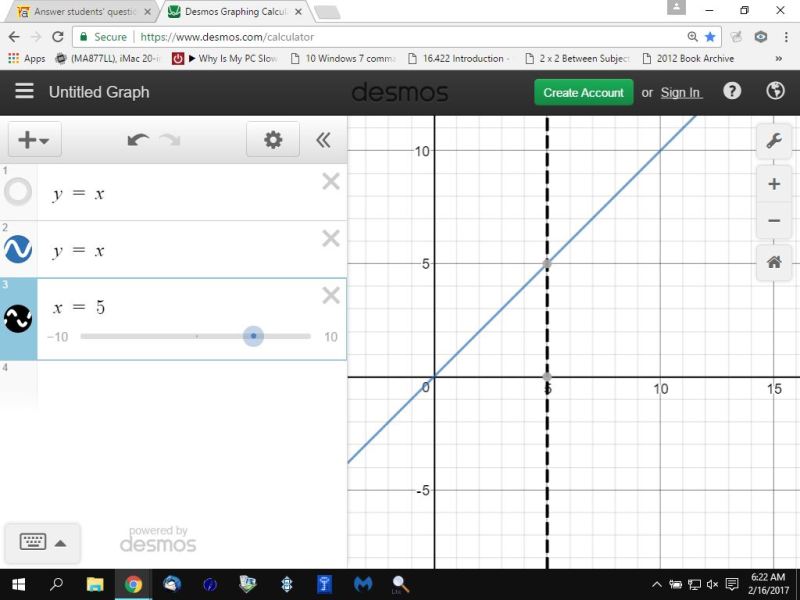
this is shown in two graphs because the lines are identical.
the first graph is the red equation.
the second graph is the blue equation.
they're the same equation because the lines are identical, meaning they have the same slope and the same y-intercept, which in this case is equal to 0.
each equation will draw the same exact line on the graph.
|
|
|