Question 996884: The function P(t) = 145e^-0.092t models a runnerĺs pulse, P(t), in beats per minute, t minutes after a race, where 0 ≤ t ≤15. Graph the function using a graphing utility. TRACE along the graph and determine after how many minutes the runnerĺs pulse will be 70 beats per minute. Round to the nearest tenth of a minute. Verify your observation algebraically.
I understand that t=7.9 but would like an explanation of how to graph this in a graphing utility such as Microsoft mathematics. I would greatly appreciate the help.
Answer by Theo(13342)   (Show Source): (Show Source):
You can put this solution on YOUR website! the one i use the most is desmos online calculator
it's an excellent calcjulator that give you good flexibility in how to enter your equations.
it dos have some problems, liie showing the minus sign in the equation.
it's there but not shown.
you have to learn how to use it.
go to their main website on www.desmos.com and there should be some instructions somewhere on there.
pretty much you enter the equation as it's written.
you also need to learn to use the tab to move from one section to another, like getting out of a set of parentheses or doing a divide and then exiting the divide operation.
a couple of trial and error and you'll get the idea (maybe more than a couple).
for example:
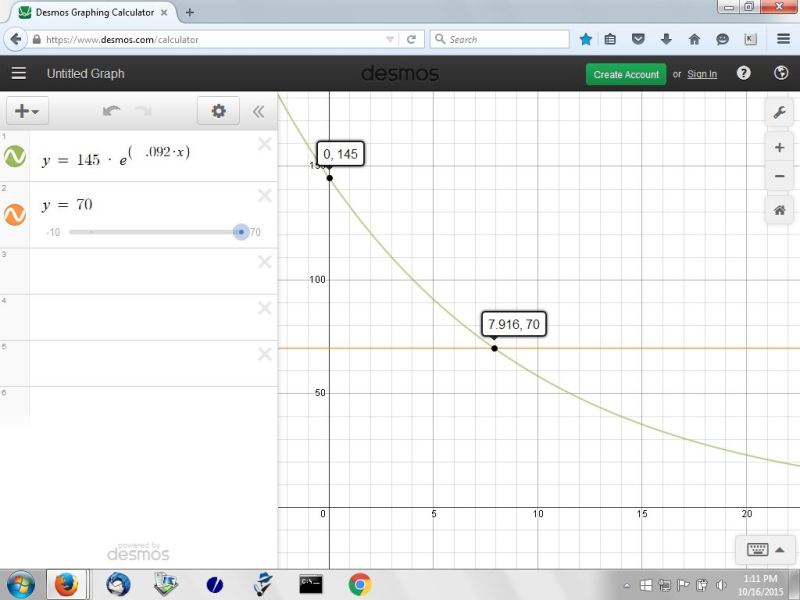
i entered y = 145 * e^(-.092x) and then i had to enter a tab to get out of the exponent area if i was going to do something else afterward.
taking into account the idiosynchrosies, it's still an excellent graphing utility for two dimensional graphs.
i entered the equation of y = 70 and then i clicked on the intersection of that with the first equation and it shows what the intersection values are.
you can see from the grpah that, when x = 7.916, y = 70, as you had calculated by hand.
check it out.
don't be afraid to contact them with questions.
they have been very helpful in the past.
here's the graph of your equation.
|
|
|