I need your help with this: Graph the function.
Thanks

The graph on the left below is of  , and the graph on the right
is the graph of
, and the graph on the right
is the graph of  :
:

 The graph on the left of y=x+4 is only valid for f(x) when
  ,
so we cut off the left half and since it does not include the
point (0,4), we put an open circle at the point (0,4) to show that that
point is not included.
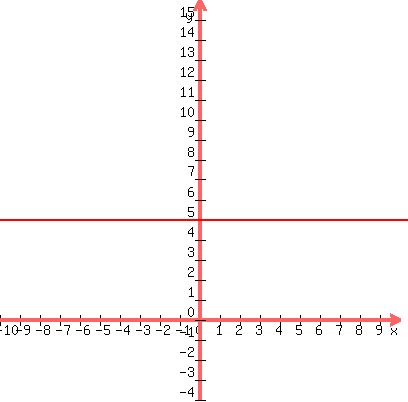
The graph on the right of y=5 is only valid for f(x) when
,
so we cut off the left half and since it does not include the
point (0,4), we put an open circle at the point (0,4) to show that that
point is not included.
The graph on the right of y=5 is only valid for f(x) when  ,
so we cut off the right half and since it includes the point (0,5), we
put a closed circle at the point (0,5) to show that that point is
included.
,
so we cut off the right half and since it includes the point (0,5), we
put a closed circle at the point (0,5) to show that that point is
included.

 Now we merge those two graphs together on one set of axes:
 Edwin
Edwin

