SOLUTION: how can u graph y>x+3
Algebra
->
Equations
-> SOLUTION: how can u graph y>x+3
Log On
Algebra: Equations
Section
Solvers
Solvers
Lessons
Lessons
Answers archive
Answers
Click here to see ALL problems on Equations
Question 289176
:
how can u graph y>x+3
Answer by
Theo(13342)
(
Show Source
):
You can
put this solution on YOUR website!
You graph y = x+3 and then you shade in the area above the line of the equation.
The graph looks like this:
Since the equation is y > x+3, any value of y above that line will be valid.
For example:
When x = 0, y = 3 in the equation y = x + 3.
When x = 0, y > 3 in the equation y > x + 3.
Any value above y = 3 when x = 0 is valid.
If you look at y > x + 3 for all values of x, then y = x + 3 is the line and y > x + 3 is any value above the line.
If you had several equations, like y < 5, x > 0 and y > x + 3, then you would graph all 3 equations of:
y = 5
x = 0
y = x + 3
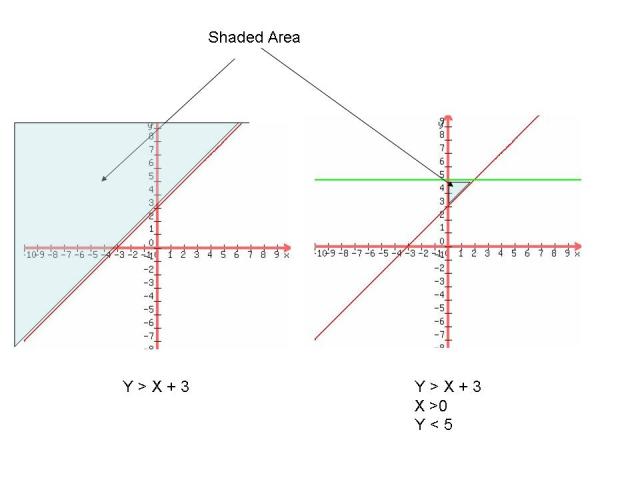
and you would shade in the area on the graph that is above the line y = x + 3, to the right of x = 0, and below y = 5.
The graph of those equations would look like this:
A picture of these 2 graphs with their shaded areas is shown below: