Question 1080841: What are two different sets of parametric equations for y = x˛ + 10?
Answer by Theo(13342)   (Show Source): (Show Source):
You can put this solution on YOUR website! i believe it's going to be:
x = t
y = t^2 + 10
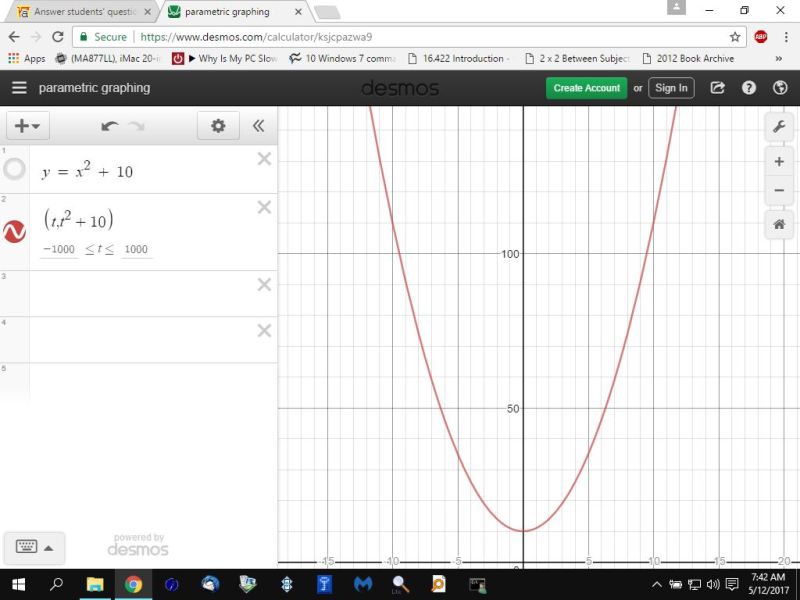
using the desmos.com calculator, you would graph this as (t,t^2+10)
desmos.com graphing calculator can be found at https://www.desmos.com/calculator
when you graph a function of t, you have to include the limits of t.
in this case i chose -1000 to 1000
in fact, there is no limit to t in this set of equations, so my choice was arbitrary, but i gave t enough range to show the graph accurately based on the scale of the graph.
there are 3 graphs to show below.
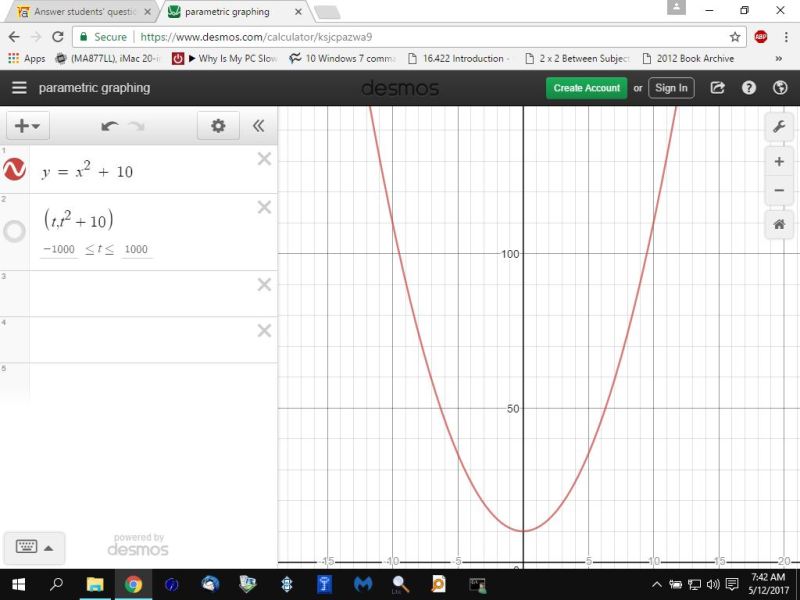
the first graph is graphing the function of (t,t^2+10)
the second graph is graphing the function of y = x^2 + 10
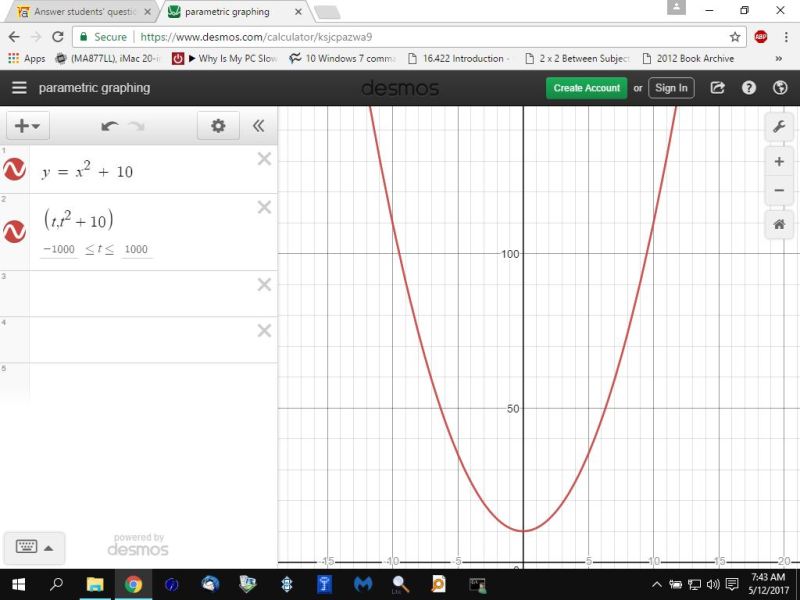
the third graph is graphing both functions to show you that they create the same identical graph.
in fact, though, the limits on t will determine how much to graph.
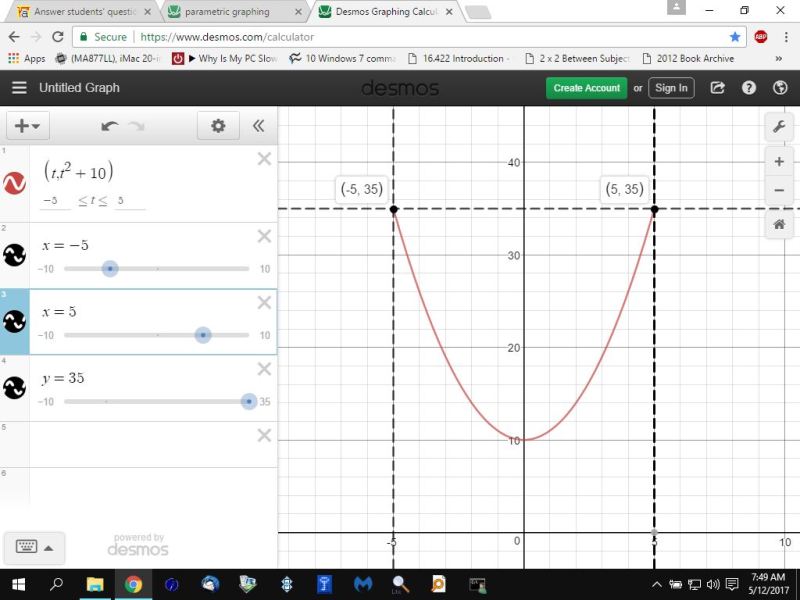
for example, if i had set the limits of t to go from -5 to 5, then the graph of the parametric equation would have been limited as follows:
x = t would allow the value of x to go from -5 to 5.
y = t^2 + 10 would allow the value of y to go from 10 to 35.
that graph is shown below:
|
|
|