Question 88824: If anyone can help I will be eternally grateful. How do you graph y>3
Answer by bucky(2189)   (Show Source): (Show Source):
You can put this solution on YOUR website! Given:
.
y > 3
.
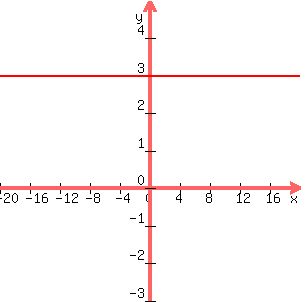
If you graph y = 3, you find that the graph is a horizontal line that crosses the y-axis at
+3 as shown below:
.
.
This graph tells you that no matter what the value of x is, the corresponding value of
y must be 3. As examples all of the following points are on the graph: (-300,3) (-10,3), (0, 3),
(5, 3), (200,3). As stated above, no matter what the value of x is, the value of y is 3.
.
But your problem says that y is greater than three. So this time, no matter what the value
of x is the corresponding value of y must be greater than 3. As examples, the following
points satisfy this relationship: (-300,4), (-10,15), (0,5), (5, 5), (200, 3.2). The reason
these points satisfy the inequality is that in every one of those points the value of y
is greater than 3.
.
How do you show this on a graph? Go back to the above graph that shows the graph of y = 3.
Take your pencil and shade in every bit of space ABOVE the line y = 3. (That shading
would be above the line and all the way from x approaching minus infinity to x approaching
positive infinity.) Make sure your shaded area is ABOVE the line and does NOT include
the line y = 3 but does include all values of y ABOVE the line and as high as you can go
... including up to y approaching positive infinity. Any point in that shaded area will
have a value of y that is greater than 3. So the graph of y > 3 is the entire shaded area
above the line y = 3.
.
Although this is not part of the above problem, you could graph the inequality y < 3 in a similar
manner. To graph this new inequality, you would shade in the entire region BELOW the graph of
the line y = 3. Any point in this region below the line will have a value of y that is
LESS than 3, and therefore, any point in this shaded region will satisfy the inequality
y < 3. Therefore, this shaded region below the line y = 3 is the graph you need for this
new inequality of y < 3.
.
Hope this makes sense to you and gives you a feel for graphing inequalities by shading
in regions of the graph as it relates to an equation (in this problem, as it relates to
the equation y = 3).
|
|
|