Solve the following system of linear
inequalities by graphing.
3x + 4y < 12
x + 3y < 6
x > 0
y > 0
First get the equations of the boundary lines.
These are lines whose equations are found by
replace the inequality sumbols in the inequalities
by equal signs. The boundary lines have these
equations:
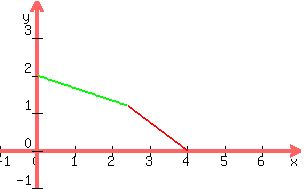
3x + 4y = 12 has intercepts (4,0) and (0,3)
x + 3y = 6 has intercepts (6,0) and (0,2)
x = 0 the y-axis
y = 0 the x-axis
The last two inequalities x > 0 and y > 0 restrict
the graphing to the upper right hand quadrant, above
the x-axis and to the right of the y-axis. Plot the
intercepts and draw a DOTTED line through them. I
can draw only a solid line here, but you can draw a
dotted one on your paper. You would draw a solid
line if the inequality symbol were " < " or " >."
But you draw a dotted line whenver the symbol is " < "
or " > "
 Substitute the origin (x,y) = (0,0) in each of the
inequalities. If the result is a true numerical statement,
then the graph of the inequality is on the side of the
boundary line that the origin (0,0) is on. If the result
is a false numerical statement, the graph of the
inequality is on the side of the boundary line that the
origin is not on.
Substituting (x,y) = (0,0) in 3x + 4y < 12
3(0) + 4(0) < 12
0 < 12
That is true, so the graph will be on the
same side of the red boundary line that the
origin (0,0) is on. So it will be BELOW the
red line.
Substituting (x,y) = (0,0) in x + 3y < 6
(0)+ 3(0) < 6
0 < 6
That is also true, so the graph will be on the
same side of the green boundary line that the
origin (0,0) is on. So it will be BELOW the
green line.
So the graph is the area which is below both
the red and the green line, and also which
is above the x-axis and to the right of the
y-axis. It is this area:
Substitute the origin (x,y) = (0,0) in each of the
inequalities. If the result is a true numerical statement,
then the graph of the inequality is on the side of the
boundary line that the origin (0,0) is on. If the result
is a false numerical statement, the graph of the
inequality is on the side of the boundary line that the
origin is not on.
Substituting (x,y) = (0,0) in 3x + 4y < 12
3(0) + 4(0) < 12
0 < 12
That is true, so the graph will be on the
same side of the red boundary line that the
origin (0,0) is on. So it will be BELOW the
red line.
Substituting (x,y) = (0,0) in x + 3y < 6
(0)+ 3(0) < 6
0 < 6
That is also true, so the graph will be on the
same side of the green boundary line that the
origin (0,0) is on. So it will be BELOW the
green line.
So the graph is the area which is below both
the red and the green line, and also which
is above the x-axis and to the right of the
y-axis. It is this area:
 You will need to shade that area, which I can't do
on here, but which you can do on your paper. You
will also need to draw both the red and the green
line dotted, which I also can't do here, but which
you can do on your paper.
The solution is this shaded area.
Edwin
You will need to shade that area, which I can't do
on here, but which you can do on your paper. You
will also need to draw both the red and the green
line dotted, which I also can't do here, but which
you can do on your paper.
The solution is this shaded area.
Edwin

