Question 63983: for the function y= 1/x-1, give the y values for x=-2, -1, 0, 1, 2, 3. Using these points, draw a curve and show the graph.
Answer by praseenakos@yahoo.com(507)   (Show Source): (Show Source):
You can put this solution on YOUR website! QUESTION:
for the function y= 1/x-1, give the y values for x=-2, -1, 0, 1, 2, 3. Using these points, draw a curve and show the graph.
ANSWER:
The function is
y = 1/x-1 ( as the function is not clear, I take the equation as (1/x)-1 )
Values of x is given as, x = -2, -1, 0, 1, 2, 3.
Input these values in the given equation.
When x = -2 , y = (1/-2) -1 = -0.5 -1 = -1.5
When x = -1 , y = (1/-1) -1 = -1 -1 = -2
When x = 0 , y = (1/0) -1 = 0 -1 = -1
When x = 1, y = (1/1) -1 = 1 -1 = 0
When x = 2 , y = (1/2) -1 =0.5 -1 = -0.5
When x = 3 , y = (1/3) -1 = 0.3 -1 = 0.7
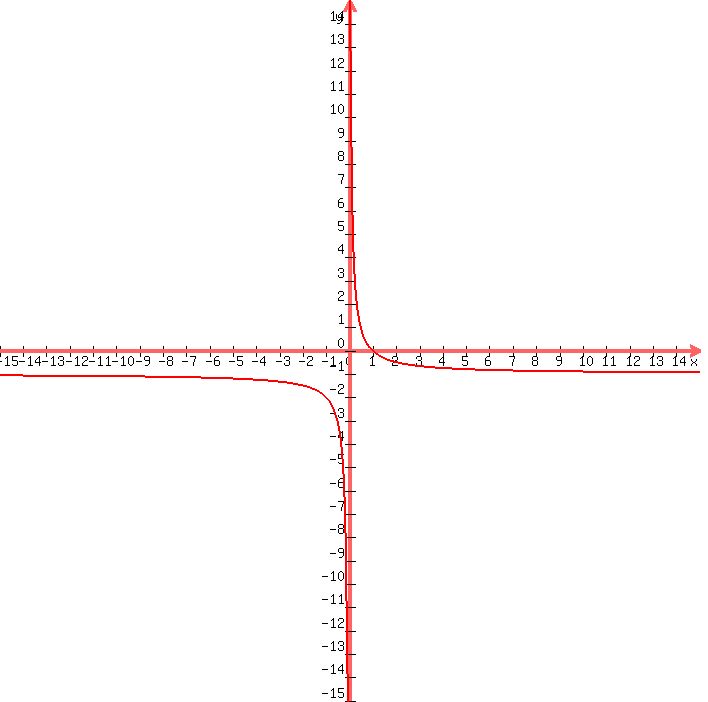
Using these points, plot the graph.
Then it comes like this,
Hope you understood.
Regards,
praseenakos@yahoo.co.in
|
|
|