SOLUTION: Please help with this problem. 1) As a science project, Anwar monitored the content of carbon monoxide outside his house in the city over several days. He found that it reached a

Algebra ->  Trigonometry-basics -> SOLUTION: Please help with this problem. 1) As a science project, Anwar monitored the content of carbon monoxide outside his house in the city over several days. He found that it reached a       Log On


Question 416950: Please help with this problem.
1) As a science project, Anwar monitored the content of carbon monoxide outside his house in the city over several days. He found that it reached a maximum of about 30 ppm (parts per million) at 6:00 P.M., and a minimum of 10 ppm at 6:00 A.M.
a) Model the concentration of carbon monoxide, C, in parts per million, as a function of time, t, in hours. Use a sinusoidal function.

Found 2 solutions by stanbon, htmentor:
Answer by stanbon(75887) About Me  (Show Source):
You can put this solution on YOUR website!
Please help with this problem.
1) As a science project, Anwar monitored the content of carbon monoxide outside his house in the city over several days. He found that it reached a maximum of about 30 ppm (parts per million) at 6:00 P.M., and a minimum of 10 ppm at 6:00 A.M.
a) Model the concentration of carbon monoxide, C, in parts per million, as a function of time, t, in hours. Use a sinusoidal function.
----
amplitude = (30-10)/2 = 10
-----
Period = 24 hrs
So, (2pi)/b = 24
b = (1/12)pi
-------
Phase shift = ?
The day begins at 12:00PM which is 6hrs before max.
So, -c/b = 6 hrs
So, -c/[1/12pi] = 6
-c = (1/2)pi
c = -(pi/2)
=====================
Equation:
y = 10sin[(2pi/9)x-(pi/2)]+20
----
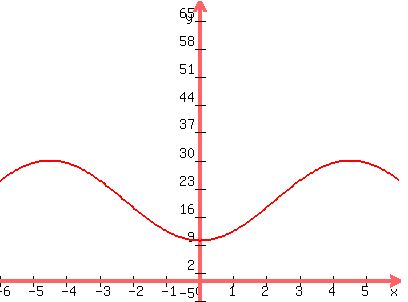
graph%28400%2C300%2C-6%2C6%2C-5%2C70%2C10sin%28%282pi%2F9%29x-%28pi%2F2%29%29%2B20%29
=====================
Cheers,
Stan H.

Answer by htmentor(1343) About Me  (Show Source):
You can put this solution on YOUR website!
Assume t=0 is 6:00 pm when the concentration is at a maximum.
12 hours later at 6:00 am, the concentration reaches a minimum.
The period of a sinusoidal function is the time required to complete one full cycle.
So the period is 24 hours since 12 hours later at 6:00 pm the concentration will again be at a maximum.
The concentration ranges from 10 to 30, so the function needs to oscillate about the midpoint (average), which is 20.
The maximum amplitude of these oscillations is +/- 10, since we have a maximum of 30 and a minimum of 10.
The general form of our periodic function will be C%28t%29+=+C0%2Acos%28%282%2Api%2FT%29t%29%2BC1
where C0 = the amplitude of oscillation and C1 is average value.
So our equation becomes C%28t%29+=+10%2Acos%28%28pi%2F12%29%2At%29+%2B+20
This equation fits the observations:
At t = 0 (6:00 pm) the concentration is C%280%29+=+10%2Acos%280%29+%2B+20+=+30
At t = 12 hrs (6:00 am) the concentration is C%2812%29+=+10%2Acos%28pi%29+%2B+20+=+-10+%2B+20+=+10
And at t = 24 hrs (one full period) we are back to the maximum value of 30.
The function looks like this:
graph%28300%2C200%2C-24%2C24%2C-30%2C30%2C10%2Acos%28pi%2Ax%2F12%29%2B20%29,