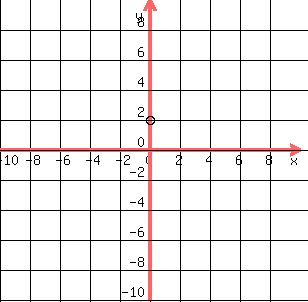
Question 117613: f(x) = 3x + 2
Could you please explain to me how to graph this.
Found 4 solutions by jim_thompson5910, checkley71, Fombitz, josmiceli:
Answer by jim_thompson5910(35256)   (Show Source): (Show Source):
You can put this solution on YOUR website!
| Solved by pluggable solver: Graphing Linear Equations |
In order to graph  we only need to plug in two points to draw the line we only need to plug in two points to draw the line
So lets plug in some points
Plug in x=-3

 Multiply Multiply
 Add Add
So here's one point (-3,-7)

Now lets find another point
Plug in x=-2

 Multiply Multiply
 Add Add
So here's another point (-2,-4). Add this to our graph

Now draw a line through these points
 So this is the graph of So this is the graph of  through the points (-3,-7) and (-2,-4) through the points (-3,-7) and (-2,-4)
So from the graph we can see that the slope is  (which tells us that in order to go from point to point we have to start at one point and go up 3 units and to the right 1 units to get to the next point) the y-intercept is (0, (which tells us that in order to go from point to point we have to start at one point and go up 3 units and to the right 1 units to get to the next point) the y-intercept is (0, )and the x-intercept is ( )and the x-intercept is ( ,0) ,or ( ,0) ,or ( ,0) ,0)
We could graph this equation another way. Since  this tells us that the y-intercept (the point where the graph intersects with the y-axis) is (0, this tells us that the y-intercept (the point where the graph intersects with the y-axis) is (0, ). ).
So we have one point (0, ) )

Now since the slope is  , this means that in order to go from point to point we can use the slope to do so. So starting at (0, , this means that in order to go from point to point we can use the slope to do so. So starting at (0, ), we can go up 3 units ), we can go up 3 units

and to the right 1 units to get to our next point

Now draw a line through those points to graph 
 So this is the graph of So this is the graph of  through the points (0,2) and (1,5) through the points (0,2) and (1,5)
|
Answer by checkley71(8403)   (Show Source): (Show Source):
You can put this solution on YOUR website! y=3x+2
the y intercept=2 or (0,2)
now set y=0 & solve for x:
0=3x+2
3x=-2
x=-2/3 answer or (-2/3,0)
plot these 2 points & draw a line through them:
andyou have the following graph.
 (graph 300x200 pixels, x from -6 to 5, y from -10 to 10, y = 3x +2). (graph 300x200 pixels, x from -6 to 5, y from -10 to 10, y = 3x +2).
Answer by Fombitz(32388)   (Show Source): (Show Source):
You can put this solution on YOUR website! Make a table of value of the form (x,f(x)).
Pick values.
For x=0, f(x)=3(0)+2=2
For x=1, f(x)=3(1)+2=5
For x=2, f(x)=3(2)+2=8
Don't forget some negative values also.
For x=-1, f(x)=3(-1)+2 = -1
For x=-2, f(x)=3(-2)+2 = -4
Then get graph paper.
Draw an x-axis horizontally.
Draw an f(x) or y-axis vertically.
Then plot the points.
(0,2) Zero units on the x, 2 units up (positive) on the y.

(1,5) 1 unit to the right(positive) on the x, 5 units up on the y.

(2,8)Two units on the x, 8 units up on the y.

(-1,-1) One unit left (negative), one unit down (negative) on the y.

(-2,-4)

Then finally you connect all the points together.
This function actually represents a straight line.

Answer by josmiceli(19441)   (Show Source): (Show Source):
|
|
|