Two things have been done to the original graph.
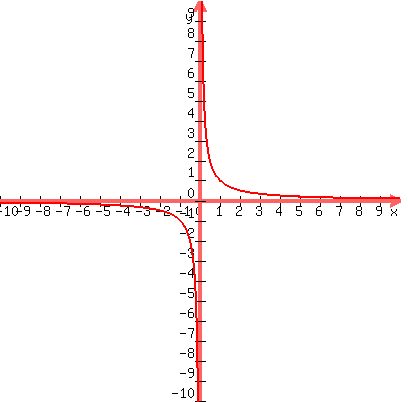
The original graph is y =  , which has this graph:
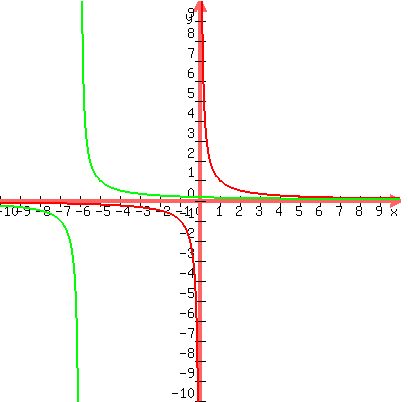
 The first thing that has been done to the original graph is
to replace the x by (x+6) which shifts the graph 6 units to the
left, giving us the graph of y =
The first thing that has been done to the original graph is
to replace the x by (x+6) which shifts the graph 6 units to the
left, giving us the graph of y =  , which is the
green graph below
, which is the
green graph below
 The second thing that has been done is to multiply the right
side by 6 which stretches the graph vertically by a factor of 6,
giving us the blue graph of y =
The second thing that has been done is to multiply the right
side by 6 which stretches the graph vertically by a factor of 6,
giving us the blue graph of y =  , which is the green
graph stretched vertically 6 times:
, which is the green
graph stretched vertically 6 times:

 Edwin
Edwin

