Question 85733: Can someone help with this one, I am stumped!
x -2 -1 0 1 2
y .111 .333 1 3 9
Given the table above, graph the function, identify the graph of the function (line, parabola, hyperbola, or exponential), explain your choice, and give the domain and range as shown in the graph, and also the domain and range of the entire function.
Graph:
Graph Type:
Explanation:
Domain:
Range:
Answer by ankor@dixie-net.com(22740)   (Show Source): (Show Source):
You can put this solution on YOUR website! x -2 -1 0 1 2
y .111 .333 1 3 9
Given the table above, graph the function, identify the graph of the function (line, parabola, hyperbola, or exponential), explain your choice,
:
This looks like an exponential equation: y = 3^x, notice when you have
an exponent x = 1; y = 3, that's the main clue, and when x = 2 (3^2) y = 9, Negative exponents would give very small values, positive exponents give large values in exponential equations
:
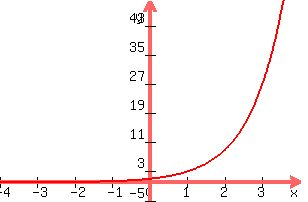
and give the domain and range as shown in the graph, and also the domain and range of the entire function.
The domain would be all real numbers, however y will never go to 0 or below so
the range would be all positive real numbers greater than 0
:
Prove this to yourself, make a table for the graph, Use a calculator
x | y
-------
-4| .01236; y = 3^-4
-3| .03704; y = 3^-3
-2| .11111; y = 3^-2
-1| .33333; y = 3^-1
0| 1; remember any number ^0 is 1
+1| 3: any number ^1 is the number
+2| 9: y = 3^2
+3| 27; y = 3^3
+4| 81; y = 3^4
:
Note that y approaches 0 but never reaches it, but no limit on it's positive value
Did this help you
|
|
|