Question 66892: Please help. I'm having trouble with this problem.
x -2 -1 0 1 2
y .111 .333 1 3 9
Given the table above, graph the function, identify the graph of the function (line, parabola, hyperbola, or exponential), explain your choice, and give the domain and range as shown in the graph, and also the domain and range of the entire function.
Graph:
Graph Type:
Explanation:
Domain:
Range:
Answer by ankor@dixie-net.com(22740)   (Show Source): (Show Source):
You can put this solution on YOUR website! The table:
x | y
-------
-2 |.111
-1 |.333
0 | 1
+1 | 3
+2 | 9
:
Given the table above, graph the function, identify the graph of the function (line, parabola, hyperbola, or exponential), explain your choice, and give the domain and range as shown in the graph, and also the domain and range of the entire function.
:
Graph Type:
Explanation:
It's an exponential function: y = n^x: n^2 = 9 and n^-1 = .333 so n = 3
y = 3^x, (matches the table)
:
Graph:
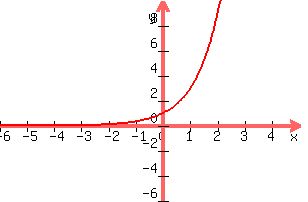
:
Domain: -/+ infinity, (all real numbers)
Range: 0, +infinity
:
Did this help?
|
|
|