|
Question 472915: I have the parabola
___
y=√x-4 (principal square root)
____
x=√y-9
How do I graph these and find out if it opens to the left, right, up, down also what quadrant does it occupy
Answer by Theo(13342)   (Show Source): (Show Source):
You can put this solution on YOUR website! the graph of y = sqrt(x-4) opens to the right as shown in the following graph of that equation.

this was easy to graph because it was in graph form (y = f(x))
the second graph of x = sqrt(y-9) needs a conversion to allow it to be graphed.
before doing that I would guess that this will open upwards.
as the value of y gets larger, the value of x will also get larger as far as I can tell.
to convert this equation to the proper form for graphing, we need to solve for y.
the equation starts out as:
x = sqrt(y-9)
square both sides of the equation to get:
x^2 = y-9
add 9 to both sides of this equation to get:
y = x^2 + 9
now it's in standard form for graphing required by algebra.com graph generator.
the graph of this equation looks like this:
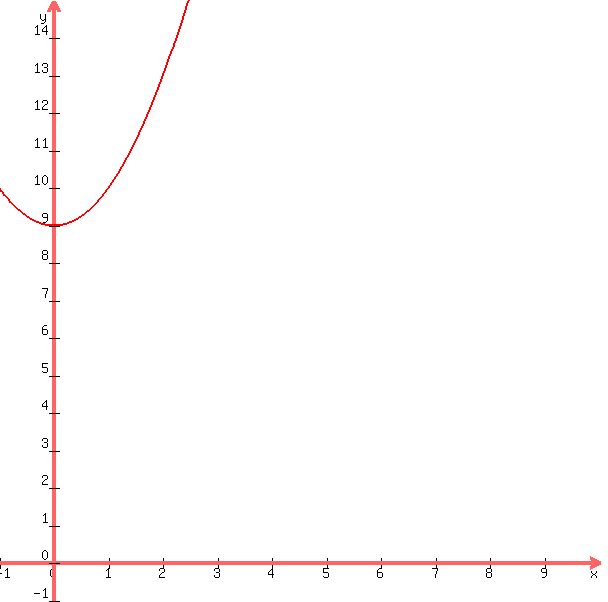
this graph is technically not correct, however.
the value of x cannot be less than 0.
this is because the original equation for this graph is:
x = sqrt(y-9)
y has to be greater than or equal to 9 because any value of y less than 9 will result in a square root of a negative number which is not allowed.
keeping the value of y greater than or equal to 9 will always result in a value of x that is positive only.
the negative value of x shown in the second graph is therefore invalid and the graph domain has to be x >= 0.
since I can't force the left half of this graph not to be there, you simply have to look only at the graph on the right side of they axis. this is the area where the value of x is greater than 0.
x = 0 is also allowed, but x smaller than 0 is not.
if you were to graph x = sqrt(y-9) manually,you would not need to go through this conversion.
you would simply make y the independent variable and x the dependent variable and plot your graph manually.
the table for the graph of y = sqrt(x-4) would look like this:
     x     y
     4     sqrt(0)
     5     sqrt(1)
     6     sqrt(2)
     7     sqrt(3)
     8     sqrt(4)
     9     sqrt(5)
etc.....
the table for the graph of x = sqrt(y-9) would look like this:
     y     x
     9     sqrt(0)
     10    sqrt(1)
     11    sqrt(2)
     12    sqrt(3)
     13    sqrt(4)
     14    sqrt(5)
etc.....
the answer to your question is:
y = sqrt(x=4) opens to the right.
x = sqrt(y-9) opens up.
it looks to me like they're both in the first quadrant (top right).
remember that the second graph is only valid when y is greater than or equal to 9 which forces x to be greater than or equal to 0.
likewise, the first graph is only valid when x is greater than or equal to 4 which forces y to be greater than or equal to 0.
|
|
|
| |