Question 932983: Given a one-way ANOVA, and given the sum of squares for error is 28, the sum of squares between treatments is 86, the mean square error is 7, and the mean square between treatments is 21.5, compute the F-statistic?
Answer by Theo(13342)   (Show Source): (Show Source):
You can put this solution on YOUR website! i believe the f-statistics is equal to msb/mse.
that would make i 21.5 / 7 = = 3.07
check out this excerpt.
The Significance Test in ANOVA (1 of 2)
next If the null hypothesis is true, then both MSB and MSE estimate the same quantity. If the null hypothesis is false, then MSB is an estimate of a larger quantity (click here to see what it is). The significance test involves the statistic F which is the ratio of MSB to MSE: F = MSB/MSE. If the null hypothesis is true, then the F ratio should be approximately one since MSB and MSE should be about the same. If the ratio is much larger than one, then it is likely that MSB is estimating a larger quantity than is MSE and that the null hypothesis is false. In order to conduct a significance test, it is necessary to know the sampling distribution of F given that the null hypothesis is true. From the sampling distribution, the probability of obtaining an F as large or larger than the one calculated from the data can be determined. This probability is the probability value. If it is lower than the significance level, then the null hypothesis can be rejected. The mathematics of the sampling distribution were worked out by the statistician R. A. Fisher and is called the F distribution in his honor. (Click here for information about the F distribution.)
here's a tutorial on the output for spss that pretty much tells you the same thing.
http://www.google.com/url?sa=t&rct=j&q=&esrc=s&source=web&cd=1&ved=0CCEQFjAA&url=http%3A%2F%2Fwww.csun.edu%2F~ataylor%2F380%2520SPSS%2520EXERCISE%2520ANSWER%2520SHEET.DOC&ei=0BWMVMn8E-XjsASq8oCYBg&usg=AFQjCNFVhAVJnE0A0us2C1xyYdwd3lGtYA&bvm=bv.81828268,d.cWc
msb = ssb / dfb
msw = ssw / dfw
f = msb / msw
i believe msw and mse meaan the seame thing (within groups)
i also think that msw and msb mean the same thing (between groups)
the terminology can be confusing when one person talks one way and another talks another way and they are both talk9ing about the same thing only you don't know it.
you can do the math and see that this is true.
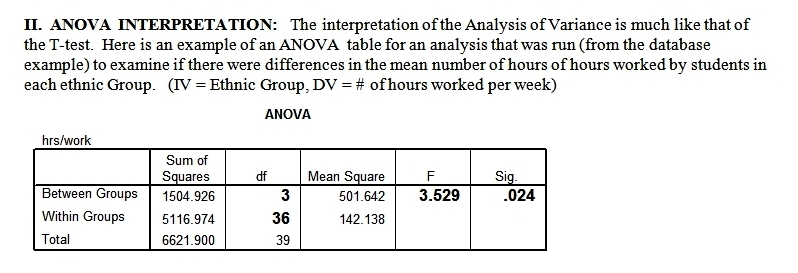
the output shows you ssb, dfb, msb and f on the first row.
it shows you ssw, dfw, msw on the second row.
look to the bottom of the spss reference.
in case you can't link to it, i took a picture and it's shown below.
The F-score is equal to msb / mse = 501.642 / 142.138 = 3.529
|
|
|