Question 495964: Please help me solve this problem: "A machine produces components in batches of 20,000,the lengths of which may be considered to be Normally distributed.At the beginning of production ,the machine is set to produce the required mean length of components at 15 mm,and it can then be set to give any one of three standard deviations : 0.06 mm, 0.075 mm, 0.09 mm.It costs $850, $550 and $100 respectively to set these deviations.Any length produced must lie in the range 14.82 mm to 15.18 mm, otherwise it is classed as defective and costs the company $1.Which standard deviation should be used,if the decision is to be made purely on the cost of setting the machine and of the defectives?"
Answer by Theo(13342)   (Show Source): (Show Source):
You can put this solution on YOUR website! machine produces components in batches of 20,000.
lengths are normally distributed.
required mean length is 15 mm.
it can be set to give one of 3 standard deviations.
they are:
.06 mm
.075 mm
.09 mm
the cost to set these deviations is:
.06 mm = $850
.075 mm = $550
.09 mm = $100
any length produced must be in the range of 14.82 mm to 15.18 mm otherwise it is classed as defective and it costs the company $1.00 per defective unit.
this involves the use of the z-tables to get the area underneath the curve pertaining to the parameters provided.
first thing to do is get the z-score for the following sets of data.
option 1:
mean is 15
standard deviation is .06
z-score for 14.82 mm
z-score for 15.18 mm
option 2:
mean is 15
standard deviation is .075
z-score for 14.82 mm
z-score for 15.18 mm
option 3:
mean is 15
standard deviation is .09
z-score for 14.82 mm
z-score for 15.18 mm
once you get the z-scores, you look into the z-tables to get the area under the curve that is between the low z-score and high z-score.
once you get that, you take 1 minus it to get the area under the curve that is outside of that range.
each set of data will give you the probability that the z-score is outside of the range provided.
once you get that, you determine the number of defective units to be expected for each set of data.
once you get that, you tally up the cost of each alternative.
the cost for each alternative is the cost for setting up the machines (given) plus the cost for each defective unit (taken from the z-table probability).
the option with the lowest cost is the winner.
finding the z-scores.
formula to find the z-score is:
x1 = low data
x2 = high data
m = mean
s = standard deviation
z1 = low z-score
z2 = high z-score
z1 = (x1 - m) / s
z2 = (x2 - m) / s
it's the same formula working on different sets of data
for option 1, the z-scores become:
z1 = (14.82 - 15) / .06 = -3
z2 = (15.18 - 15) / .06 = 3
for option 2, the z-scores become:
z1 = (14.82 - 15) / .075 = -2.4
z2 = (15.18 - 15) / .075 = 2.4
for option 3, the z-scores become:
z1 = (14.82 - 15) / .09 = -2
z2 = (15.18 - 15) / .09 = 2
now that you know the z-scores, you look in the z-table for the low z-score and the high z-score.
the z-table will give you the area to the left of that score.
to get the area in between the low z-score and the high z-score, you subtract the low probability from the high probability.
this give you the probability of being in between.
to get the area outside the low z-score and the high z-score, you take 1 - the probability of being in between which will give you the probability of being outside of that range.
the probability of being outside of that range is the probability that the unit will be defective.
i looked into the z-tables and these are the results that i found.
the table i used is shown here:
http://lilt.ilstu.edu/dasacke/eco148/ZTable.htm
for option 1, the probabilities become:
z1 = (14.82 - 15) / .06 = -3 = probability of .0013
z2 = (15.18 - 15) / .06 = 3 = probability of .9987
probability of being between 14.82 and 15.18 = .9987 - .0013 = .9974
probability of being outside this range = 1 - .9974 = .0026
for option 2, the z-scores become:
z1 = (14.82 - 15) / .075 = -2.4 = probability of .0082
z2 = (15.18 - 15) / .075 = 2.4 = probability of .9918
probability of being between 14.82 and 15.18 = .9918 - .0082 = .9836
probability of being outside this range = 1 - .9836 = .0164
for option 3, the z-scores become:
z1 = (14.82 - 15) / .09 = -2 = probability of .0228
z2 = (15.18 - 15) / .09 = 2 = probability of .9772
probability of being between 14.82 and 15.18 = .9772 - .0228 = .9544
probability of being outside this range = 1 - .9544 = .0456
now we get into number of defective units per batches of 20,000
for option 1, the number of defective units is .0026 * 20,000 = 52
for option 2, the number of defective units is .0164 * 20,000 = 328
for option 3, the number of defective units is .0456 * 20,000 = 912
total cost for option 1 is $850 + $52.00 = $902
total cost for option 2 is $550 + $328 = $878
total cost for option 3 is $100 + $912 = $1012
option 2 is the cheapest cost option, taking into account the cost of setting up the machines and taking into account a cost of $1.00 per defective unit.
shown below are the results of looking into the z-table.
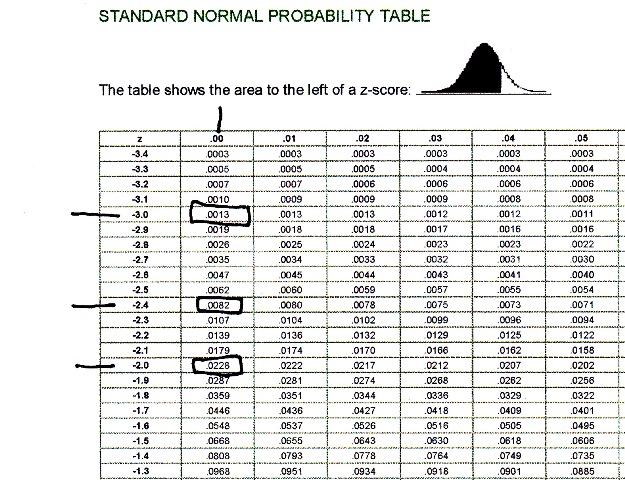
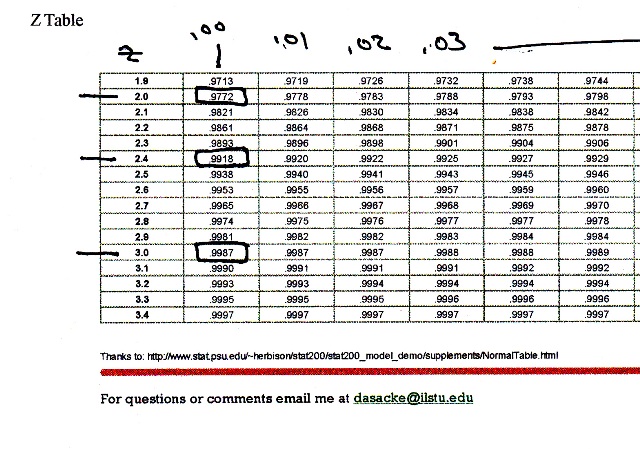
the z-table shows the area to the left of the z-score.
the area to the left of the z-score is the probability that a sample value will fall within that range.
the area between the z-scores is the probability that a sample value will fall within that range.
the area outside the z-scores is the probability that a sample value will fall outside that range.
in this problem, the probability that a value will fall outside of the range between 14.82 and 15.18 mm is the same as the probability that a sample unit will be defective.
the probability that a sample unit will be defective times the number of samples equals the number of defective units.
the number of samples is the number of units produced per batch.
a picture of the normal distribution and what we found using it is shown below.
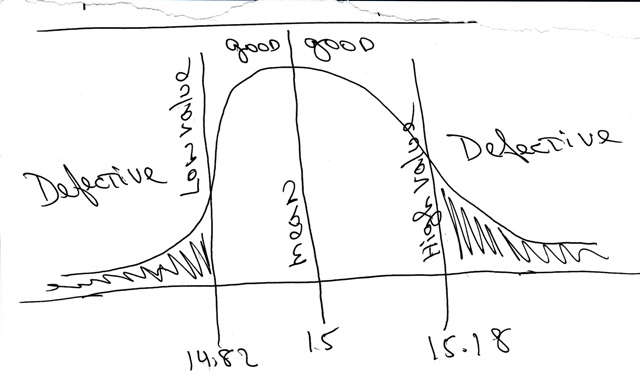
the good range is between 14.82 and 15.18 mm.
the defective range is outside that area.
the same z-score table is used for all 3 options.
what is different is the z-score.
this is because the standard deviation was different for the 3 options.
|
|
|