Question 479074: According to the U.S National Center for Health Statistics, the mean height for adult American males is μ=65.0 inches. Assume the heights are normally distributed with standard deviation of σ=3.0.
(I NEED HELP WITH PART C&D..... I INCLUDE PART A&B BECAUSE I WASN'T SURE IF YOU NEED THE INFORMATION TO COMPLETE THE OTHER PARTS.)
Determine the probability of finding an adult American male that is:
a) Less than or equal to 69.5 inches tall. .answer: .9332
b) Between 69.5 and 65.0 inches tall. answer: .4332
c) How tall must an American male be to be in the top 5% of the adult American male population?
d) About 95.44% of the adult males are between
_________ and___________ inches tall.
Answer by Theo(13342)   (Show Source): (Show Source):
You can put this solution on YOUR website! presumably you are using the z-score tables
the z-score table that i'm using is shown here.
http://lilt.ilstu.edu/dasacke/eco148/ZTable.htm
the z-score is calculated as:
(score - mean) / standard deviation.
for example:
z-score of 69.5 = (69.5-65)/3 = 1.5
you then look up the z-score of 1.5 in the z-score table and you get .9332.
this means that 93.32% of the population is below the height of 69.5.
if you want to know the percentage of the population that is between 65 and 69.5, you would get the z-scores of both to get:
z-score of 65 = (65-65)/3 = 0
Z-score of 69.5 = 1.5 (derived earlier)
you would then look up the z-scores for 0 and 1.5 in the table and get:
0 = .5
1.5 = .9332
you would then subtract .5 from .9322 to get .4322
this mean that 43.22% of the population is between the heights of 65 inches and 69.5 inches.
so far i'm just confirming you did parts a and b correctly while showing you how this particular table is being used. the tables are different so you need to be aware of how the particular table is being used in order to use that table correctly.
-----
in part c, you are being asked:
How tall must an American male be to be in the top 5% of the adult American male population?
since the z-score tells you the ratio of the population that is below that figure, then you need to look for a ratio of 1 - .05 = .95.
looking in the table, i don't see a .95 ratio, but i do see a ratio of .9495 and a ratio of .9505.
the ratio of .95 will be between these z-scores.
find the z-score that belongs to the ratio of .9495 and .9505 and write them down.
the z-score corresponding to a ratio of .9495 = 1.64
the z-score corresponding to a ratio of .9505 = 1.65
.95 is roughly halfway between .9495 and .9505.
this means your z-score will be roughly halfway between 1.64 and 1.65.
the z-core you are looking for will be approximately 1.645
now you need to translate that back to a real score.
you know that your z-score formula is:
z-score = (a-m)/s
a = your actual score
m = the mean
s = the standard deviation
plug in the values that you know and solve for the unknown.
you get:
1.645 = (a - 65)/3
multiply both sides of this equation by 3 to get:
4.935 = a - 65
add 65 to both sides of this equation to get:
69.935 = a.
that's your answer.
your actual score is equal to 69.935.
a height of 69.935 is greater than 95% of the population which puts that person in the top 5% of the population height wise.
-----
in part d, you are being asked:
about 95.44% of the adult males are between
_________ and___________ inches tall.
this means that 100 - 95.44 = 4.56% of the population are outside of those limits which means that 2.28% of the population are below those limits and 2.28% of the population are above those limits.
your low side ratio will be .0228.
your high side ratio will be .0228 + .9544 = .9772
look those values up in the table to get:
ratio of .0228 = a z-score of -2.0
ratio of .9772 = a z-score of 2.0
they actually made it easier for you this time around.
no interpolation is necessary.
translate those z-scores into actual scores using the formula:
z = (a-m)/s
z is the z-score
a is the actual score
m is the mean
s is the standard deviation.
you get:
-2.0 = (a-65)/3 which becomes:
-6 = a-65 which becomes:
a = 59
that's your low score.
for the high score, you get:
2.0 = (a-65)/3 which becomes:
6 = - 65 which becomes:
a = 71
that's your high score.
95.44% of the population should be between 59 and 71.
now that we did it the hard way, i'll show you the easy way.
here's a link to the z-score calculator.
http://davidmlane.com/hyperstat/z_table.html
you can use it to check your answers.
use the top table to find your percents given your z-scores.
use the bottom table to find your z-scores given your percent.
your questions are:
Determine the probability of finding an adult American male that is:
a) Less than or equal to 69.5 inches tall. .answer: .9332
b) Between 69.5 and 65.0 inches tall. answer: .4332
c) How tall must an American male be to be in the top 5% of the adult American male population?
d) About 95.44% of the adult males are between
_________ and___________ inches tall.
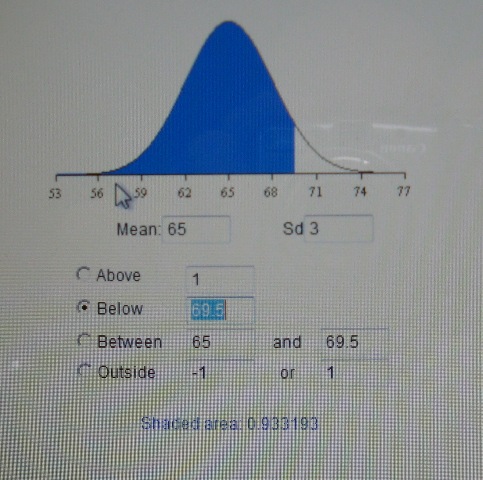
to answer question a, enter a mean of 65 and a standard deviation of 3 into the top table and then enter a value of below 69.5 to get an answer of .933193 which rounds to .9332
here's a picture of what that looks like.
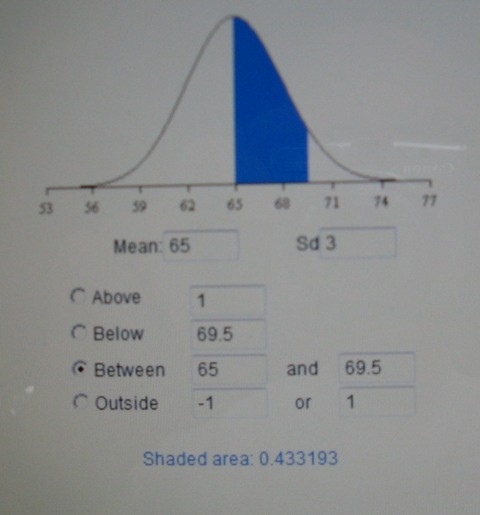
to answer question b, enter a mean of 65 and a standard deviation of 3 into the top table and then enter a value of between 65.0 and 69.5 to get an answer of .433193 which rounds to .4332.
here's a picture of what that looks like.
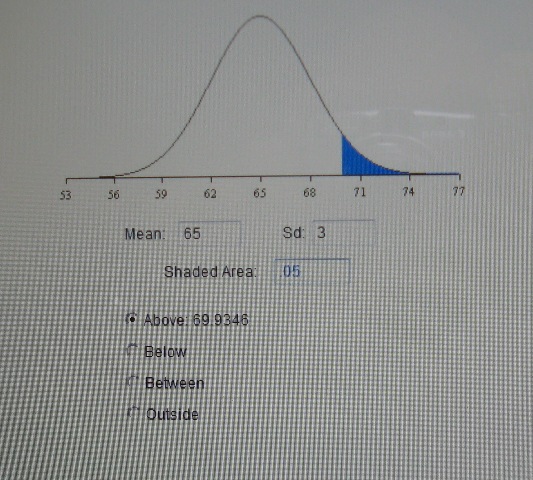
to answer question c, enter a mean of 65 and a standard deviation of 3 and a value of .05 in the shaded area of the bottom table and then click on above to get an answer of above 69.9346 which rounds to above 69.935.
here's a picture of what that looks like.
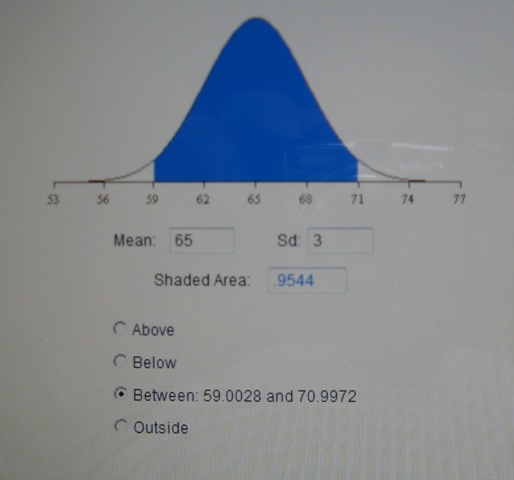
to answer question d, enter a mean of 65 and a standard deviation of 3 and a shaded area of .9544 in the bottom table and then click on between to get an answer of between 59.0028 and 70.9972 which rounds to between 59 and 71.
here's a picture of what that looks like.
if you absolutely have to use the z-tables, you now know how to do that.
if you don't, then the use of this calculator makes the job a lot easier.
|
|
|