Question 179573: The following data are the numbers of local channels available in 19 cities.
11,32,32,19,5,38,17,12,37,34,16,6,11,27,7,21,15,22,18
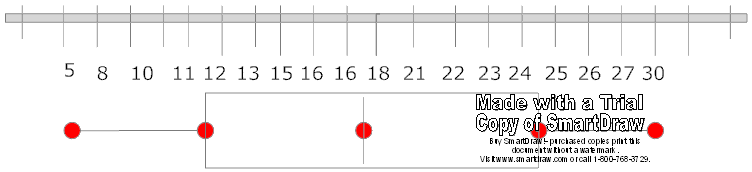
construct a box-and-whisker plot for the data
Answer by Mathtut(3670)   (Show Source): (Show Source):
You can put this solution on YOUR website! points are made under the lowest, highest,1st quartile, median, 3rd quartile
:
then a box is created around the 1st and 3rd quartiles with a line made throught the median then whiskers are drawn to the lowest and highest data.
:
lowest-5
1st quartile is 4th and 5th terms divided by 2 : 11+12/2=11.5
median is the 9th and 10 terms added and divided by 2: 16+17/2=16.5
3rd quartile is 14 and 15 terms added and divided by 2: 24+25/2=24.5
highest-30
|
|
|