Question 1210349: A random sample of 16 pharmacy customers showed the waiting times below (in minutes).
20 14 23 22 22 15 21 18
23 17 14 25 15 21 20 14
Find a 90 percent confidence interval for μ, assuming that the sample is from a normal population.
Found 2 solutions by Edwin McCravy, math_tutor2020:
Answer by Edwin McCravy(20066)   (Show Source): (Show Source):
You can put this solution on YOUR website!
I decided to do a recently posted statistics problem.
Not because I like them, I don't. But because high schools and colleges are
striving to make math courses practical in the workplace.
Face it, algebra, geometry, and trig are no longer practical in any workplace,
for computers do it all. Engineers these days do nothing but point and click.
Statistics is the only thing that's still practical in nearly every field.
So schools began to push statistics, because it only requires first year
algebra, and with computers doing all the substituting in formulas, even
less.
When high schools began pushing statistics, this site at first had a
deluge of statistics problems posted.
However, no tutors on here would bother solving them, including yours truly, so
students learned this site was no good for posting stats problems, and this site
went to pot.
So if you tutors want to see this site start thriving again, you'd better start
solving statistics problems. For that's the only way to salvage it.
Face it, finding such things as integer solutions to randomly made-up equations
are as impractical in the workplace as making mud pies.
--------------------------
Anyway, here's my stab at a t-problem. My stats knowledge is getting rusty.
Count these data. There are 16. This is less than (or equal to) 30. That's
considered a small sample. So we will use the t-distribution, not the
normal z-distribution.
20 14 23 22 22 15 21 18
23 17 14 25 15 21 20 14
Add them, get 304
Divide by 16, get  We want the standard deviation, s.
  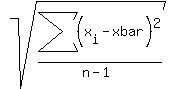 Get the deviations from the mean, by subtracting 19 from each of those in the
list.
1 -5 4 3 3 -4 2 -1
4 -2 -5 6 -4 2 1 -5
Square the deviations from the mean:
1 25 16 9 9 16 4 1
16 4 25 36 16 4 1 25
Add them, get 208
Divide by n-1, or 16-1 or 15
Get
Get the deviations from the mean, by subtracting 19 from each of those in the
list.
1 -5 4 3 3 -4 2 -1
4 -2 -5 6 -4 2 1 -5
Square the deviations from the mean:
1 25 16 9 9 16 4 1
16 4 25 36 16 4 1 25
Add them, get 208
Divide by n-1, or 16-1 or 15
Get 
 Now the formula for the margin of error is
 We calculate
     Since this is a 2-tailed test, 90 percent confidence interval leaves 10 percent
on both ends, or half that, 0.05 on each end, giving the confidence interval of
90 percent in between these two critical values.
So we look up the t-value for the number of 15 (1 less than the number in the
sample of 16) degrees of freedom for a 2-tailed test and find the value 1.753.
(or you can find the t-value on your TI-84 calculator by
2nd VARS area:0.95, df:15 ENTER ENTER ENTER,
and read more decimal values as 1.753050323)
Since this is a 2-tailed test, 90 percent confidence interval leaves 10 percent
on both ends, or half that, 0.05 on each end, giving the confidence interval of
90 percent in between these two critical values.
So we look up the t-value for the number of 15 (1 less than the number in the
sample of 16) degrees of freedom for a 2-tailed test and find the value 1.753.
(or you can find the t-value on your TI-84 calculator by
2nd VARS area:0.95, df:15 ENTER ENTER ENTER,
and read more decimal values as 1.753050323)
  That's the margin of error.
The confidence interval is
That's the margin of error.
The confidence interval is 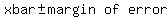 (19-1.63199507,19+1.6199507) = (17.36800493, 20.63199507).
If you use a table of t-values you won't get that many decimal places.
Edwin
(19-1.63199507,19+1.6199507) = (17.36800493, 20.63199507).
If you use a table of t-values you won't get that many decimal places.
Edwin
Answer by math_tutor2020(3817)  (Show Source): (Show Source):
You can put this solution on YOUR website!
I recommend using a spreadsheet for this type of problem.
If you want to use a TI83 or similar, then refer to the next section below.
Copy/paste the given data into a spreadsheet.
Let's say the upper left corner goes in cell A1.
This would have the lower right corner in cell H2.
In some other blank cell, say cell A4, we'll have the following command
=Average(A1:H2)
Don't forget about the equal sign up front. Otherwise the spreadsheet command will not execute.
This computes the arithmetic mean of the values from cell A1 to H2.
The result of this calculation is 19 exactly.
This is the value of xbar, which is the sample mean.
Now move to cell A5.
Type this in, or copy/paste
=Confidence.T(1-0.9,Stdev(A1:H2),Count(A1:H2))
The Confidence function produces the margin of error needed.
The "dot T" portion tells the spreadsheet to do the T distribution version. Otherwise, it defaults to the normal distribution.
We use the T distribution for two reasons: we don't know the value of sigma, and n = 16 doesnt make n > 30 true
The 3 parameters of the confidence function are:
alpha = significance level = 1-C = 1-0.90 = 0.10
stdev = standard deviation
n = sample size = number of values
You can manually type in the number of values (16), or use the Count function.
The result of the Confidence calculation is roughly 1.63200106504704, which is the approximate margin of error.
In cells A6 and A7 will be the following commands
=A4-A5
=A4+A5
They represent the lower and upper bounds of the confidence interval.
The results of the calculations are roughly 17.367998934953 and 20.632001065047
When rounding to 3 decimal places we get the confidence interval (17.368, 20.632)
Your final answer will vary depending how your teacher wants you to round.
-----------------------------------------------------------------------------------------------------------------
If you want to use a TI83 or similar, then follow these steps.
Press the button labeled "STAT". Then select "Edit".
This brings up the data tables. Clear out list L1 if it has values in it already.
Once fully empty, enter the data values into the list.
After the data is entered, quit to the home screen.
Press the STAT button again. Scroll to right to land on "Tests". Hit enter.
Scroll down until reaching "T-intveral". It's the 8th item of the list. Hit enter.
The input will be "data". The specific data is inside list L1.
The "freq" or "frequency" will be set to 1.
The C-level, aka confidence level, is set to 0.90
Scroll down to "calculate", and hit enter, to have the approximate interval (17.368, 20.632) show up.
|
|
|