Question 1205485: 12. A random sample of n = 4 individuals is selected from a population with µ = 35, and a treatment is administered to each individual in the sample. After treatment, the sample mean is found to be M = 40.1 with SS = 48.
(a)How much difference is there between the mean for the treated sample and the mean for the original population? (Note: In a hypothesis test, this value forms the numerator of the statistic.)
(b)If there is no treatment effect, how much difference is expected between the sample mean and its population mean? That is, find the standard error for M. (Note: In a hypothesis test, this value is the denominator of the t statistic.)
(c)Based on the sample data, does the treatment have a significant effect? Use a two-tailed test with α = .05.
Answer by Theo(13342)   (Show Source): (Show Source):
You can put this solution on YOUR website! sample size is 4.
sample mean is 35 before treatment.
sample mean is 40 after treatment.
SS = 48 is assumed to be sum of squares.
variance of a sample = SS / (n-1).
standard deviation of the sample = square root of that = sqrt(SS/(n-1)).
here's a reference:
https://www.westgard.com/lesson35.htm
in this problem:
sample variance = SS / (n-1) = 48/3 = 16.
sample standard deviation is square root of that = 4.
since the standard deviation is taken from the sample, then the use of of the t-statistic is indicated.
t-score formula is t = (x-m)/s
t is the t-score
x is the sample mean after treatment.
m is the population mean before treatment.
s is the standard error.
this formula is exactly the same as the z-score formula.
the difference is in the calculation of the area under the normal distribution curve to the right or the left of the indicated t-score, as opposed to thee calculation of the area under the normal distribution curve to the right or the left of the indicated z-score.
t-score uses degrees of freedom in the calculation.
z-score doesn't.
standard error = standard deviation / sqrt(sample size) = 4/sqrt(4) = 2.
t-score formula becomes t = (40 - 35) / 2 = 5/2 = 2.5.
area under the normal distribution curve to the right of with 3 degrees of freedom (= sample size minus 1) = .04385 rounded to 5 decimal digits.
answers to your questions are shown below.
(a)How much difference is there between the mean for the treated sample and the mean for the original population? (Note: In a hypothesis test, this value forms the numerator of the statistic.)
the difference is 5 (40 - 35).
(b)If there is no treatment effect, how much difference is expected between the sample mean and its population mean? That is, find the standard error for M. (Note: In a hypothesis test, this value is the denominator of the t statistic.)
standard error = standard deviation / square root of sample size = 4/sqrt(4) = 4/2 = 2.
the difference between the sample mean and the population mean is divided by this to get the t-score.
it's in the formula.
t = (x-m)/s = (40 - 35) / 2 = 2.5
what this says is that the sample mean is 2 and 1/2 standard deviations above the population mean.
note that standard error is equal to standard deviation of the distribution of sample means.
here's a reference that discusses standard error as opposed to standard deviation.
it can be confusing.
just remember, if you're looking for a difference of a sample element, then use the standard deviation, and if you're looking for a difference in sample means, use the standard error.
you are looking for a difference in the sample mean versus the population mean here, so use the standard error.
here's a reference.
https://www.investopedia.com/ask/answers/042415/what-difference-between-standard-error-means-and-standard-deviation.asp
(c)Based on the sample data, does the treatment have a significant effect? Use a two-tailed test with α = .05.
t-score is 2.5.
area to the right of that t-score, with 3 degrees of freedom = .04385
that's your test p-value.
here's what it looks like on a graph.
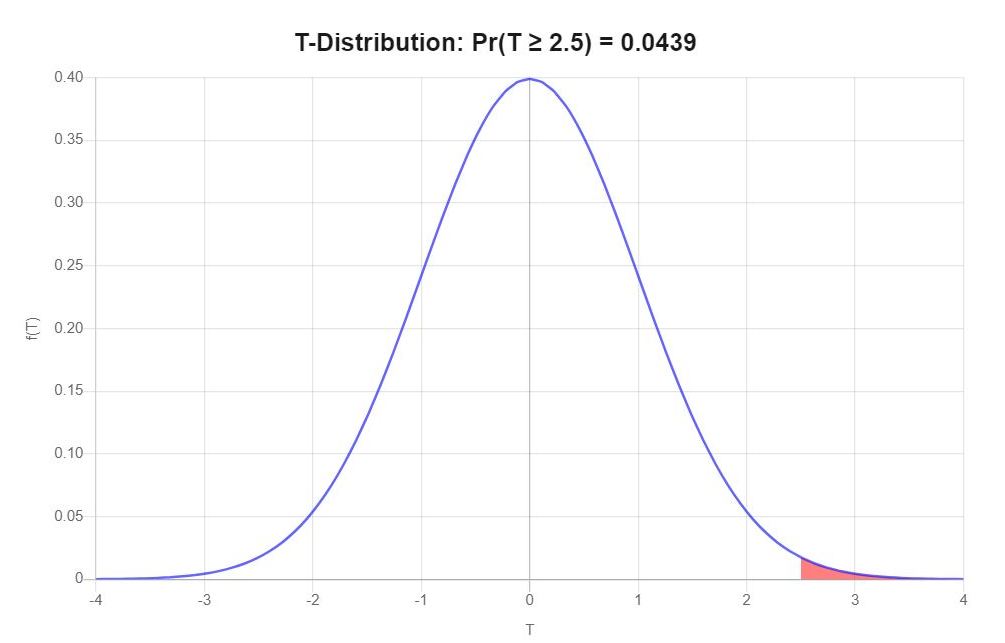
here's what the critical t-value and p-value with 3 degrees of freedom look like on a graph.
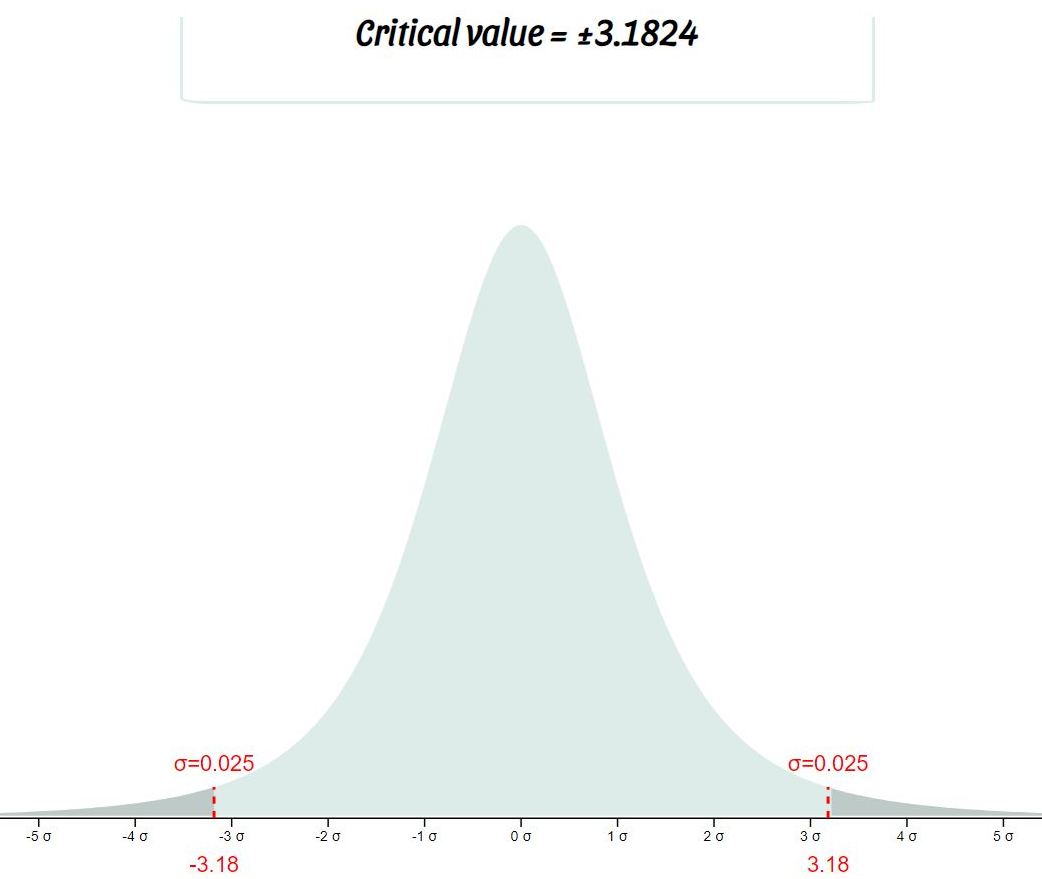
two-tailed critical p-value at 95% confidence interval = .025 on each end.
since .04385 p-value on the right end is greater than that, then the results are not considered significant, leading to the conclusion that there isn't enough information to justify saying that the sample mean is different from the population mean.
test for significance is:
if the test z-score is greater than the critical z-score, or if the test p-value is less than the critical p-value, then the results are considered significant.
note that, if you were using z-score rather than t-score, the area to the right of a z-score of 2.5 would be equal to .00621.
the results would have been considered significant in that case, because the test p-value was less than the critical p-value of .025.
the formula to find the t-score is the same as the formula to find the z-score.
the difference is in the calculation of the area to the right or to the left of the indicated score.
let me know if you have any questions.
theo
|
|
|