Question 1142656: Hello, this is a statistics problem. Is there a formula that I would use to find the minimum and maximum values below?
Use the following information to determine your answers: The typical amount of sleep per night that adults get has a bell-shaped distribution with a mean of 7.5 hours and a standard deviation of 1.3 hours.
About 68% of adults typically sleep between a minimum of ___ hours a night and a maximum of ____ hours a night.
Answer by Theo(13342)   (Show Source): (Show Source):
You can put this solution on YOUR website! the typical amount of sleep per night has a mean of 7.5 hours and a standard deviation of 1.3 hours.
about 68% of adults typically sleep between a minimum of x hours a night and a maximum of y hours a night.
you want to find the value of x and y.
you need to find the z-score of the low end of the 68% and you need to find the z-score of the high end of the 68%.
the 68% is assumed to be in the middle of the normal distribution curve.
there would be two tails:
one on the left of the low end z-score.
the other on the right of the high end z-score.
you can use the z-score tables, or you can use a z-score calculator.
the use of a z-score calculator is the easiest and the most accurate.
usually, accuracy to 2 decimal places is sufficient.
the z-score tables only give you z-score rounded to 2 decimal places.
if you need more accuracy, then you would need to interpolate.
the calculators give you a minimum of rounding to 3 decimal places, i believe.
one such calculator can be found at .
your area under the normal distribution curve is .68.
your tails on each end would be (1 -.68) / 2 = .32/2 = .16.
the tail on the lower end is to the left of the low end z-score.
the tail on the upper end is to the right of the high end z-score.
since the normal distribution curve is symmetric about the mean, if you find the low end z-score, then the high end z-score will be the same value except with a different sign.
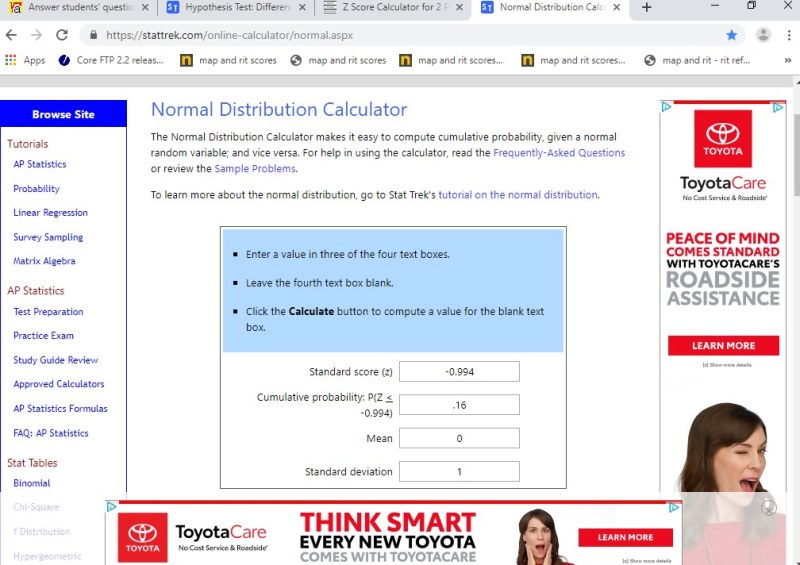
so, you use the online calculator to find the low end z-score.
you are looking for a z-score that has p(Z < x) equal to .16.
that means that the area to the left of the low end z-score is .16.
the calculator tells you that the low end z-score is minus .994 rounded to 3 decimal places.
since the normal distribution is symmetric about the mean, your high end z-score should be plus .994.
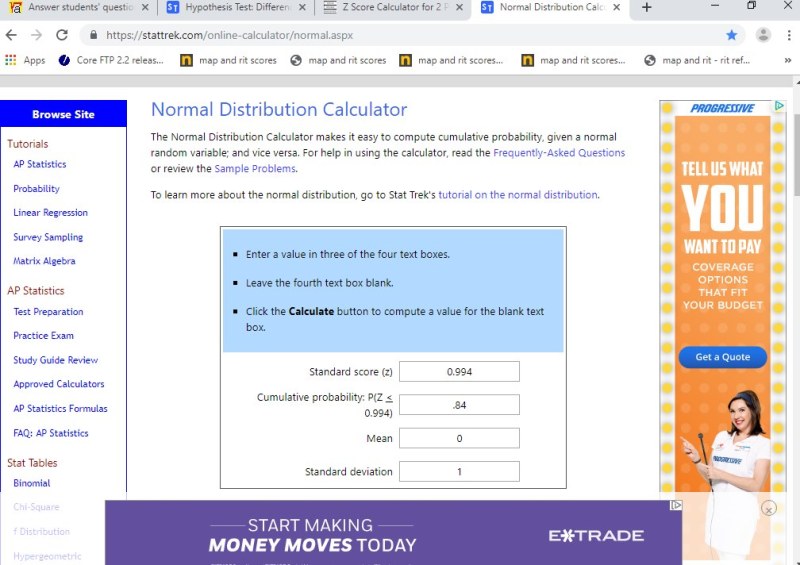
you can test to see if this is true by looking for the area of .16 to the right of the high end z-score.
since this calculator only gives you the area to the left of the z-score, you would take .16 and subtract it from 1 to get .84.
a z-score with an area of .84 to the left of it is the same z-score with an area of .16 to the right of it.
use the calculator again to get z = plus .994
this confirms the symmetry of the normal distribution curve about the mean.
you have a low end z-score of minus .994.
you have a high end z-score of plus .995.
the next step is to calculate the raw score associated with the z-score.
the z-score formula is z = (x-m)/s
z is the z-score.
x is the raw score.
m is the mean.
s is the standard deviation, in this case.
in this problem, m is equal to 7.5 and s is equal to 1.3.
the low end z-score formula becomes -.994 = (x-7.5)/1.3.
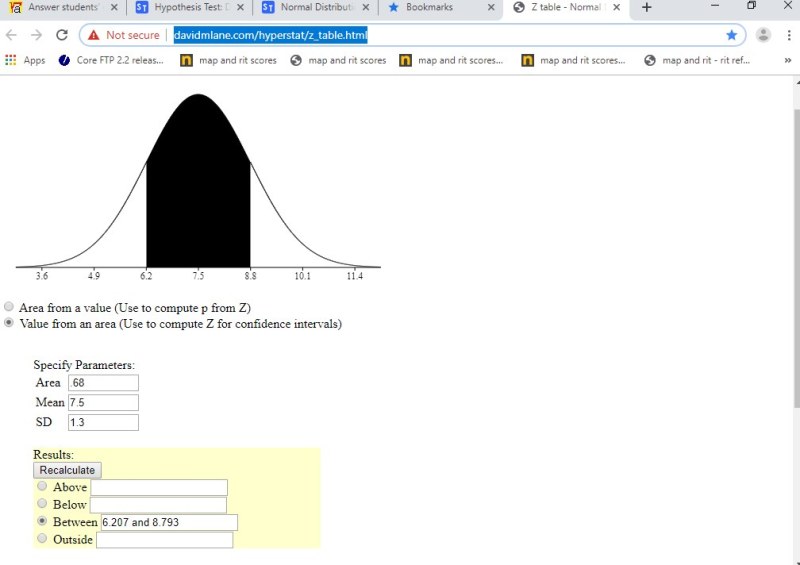
solve for x to get x = -.994 * 1.3 + 7.5 = 6.2078
the high end z-score formula becomes .994 = (2-7.5)/1.3
solve for x to get x = .994 * 1.3 + 7.5 = 8.7922.
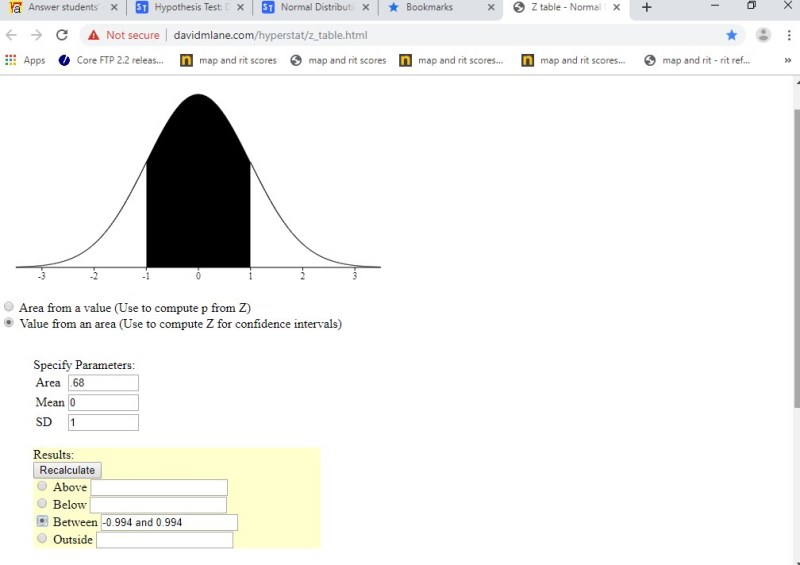
visually, this looks like this, using another online calculator that is more sophisticated and also gives you a graphical presentation.
that calculator can be found at http://davidmlane.com/hyperstat/z_table.html
the following displays were used.
the first two are from the stattrek calculator.
the third display is from the david m. lane calculator using z-scores.
the fourth display is from the david m .alen calculator suing raw scores.
|
|
|