Question 1119576: The customers accounts at a certain department store have an average balance of shs.480 and standard deviation she.160.Assuming that the account balances are normally distributed. 1) What proportion of the accounts is over shs.600. 2)What proportion of the accounts is between shs.400 and shs. 600.
Answer by Theo(13342)   (Show Source): (Show Source):
You can put this solution on YOUR website! the mean is 480 and the standard deviation is 160.
z = (x-m)/s
z is the z-score.
x is the raw score.
m is the raw mean
s is the standard deviation.
the z-score associated with a raw score of 600 is found using this formula.
z = (x-m)/s becomes z = (600 - 480) / 160 = .75
this says that the raw score of 600 is .75 standard deviations above the mean.
you would look up in the z-score tables, or use a z-score calculator, to determine the proportion of the area under the normal distribution curve that is to the left of this z-score.
using the TI-84 Plus Calculator, i determined that the area to the left of a z-score of .75 is equal to .7733727206
that's the proportion of the area under the normal distribution curve that is to the left of the z-score of .75.
that is also the probability that you would encounter a z-score less than .75 from any random sample of elements that make up that normal distribution.
since the z-score was derived from a raw score of 600, that is also the probability that you wound encounter a raw score in your distribution that would be less than 600.
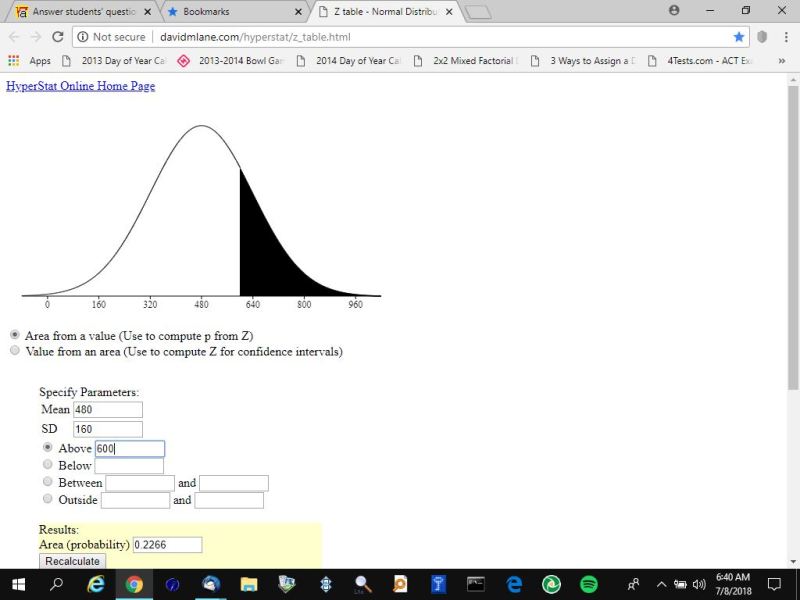
since the total proportion of the area under the normal distribution curve is 1.0, then the area to the right of the z-score of.75 is equal to 1 - .7733727206 = .2266272794.
that's the probability that you would get a raw score greater than 600 from your distribution of raw scores in the population.
to find the area under the normal distribution curve between 400 and 600, you would find the z-score associated with those two values.
you already have the z-score associated with 600.
it is .75.
the z-score associate with 400 would be z = (400 - 480) / 160 = -.5.
you would go to the z-score tables, or use a z-score calculator to find the area to the left of a z-score of -.5.
using the TI-84 Plus calculator, i found that area to be equal to .3085375322.
that area is also the probability that you would get a raw score less than 400.
to find the area in between, subtract the smaller area from the larger area.
you will get .7733727206, which is the area to the left of a z-score of .75 and its associated raw score of 600, minus .3085375322, which is the area to the left of a z-score of -.5 and its associated raw score of 400.
.7733727206 minus .3085375322 = .4648351884.
that's the area between a z-score of -.5 and a z-score of .75.
that's also the area between a raw score of 400 and a raw score of 600.
that's also the probability that you will get a raw score between 400 and 600 if you randomly draw a sample element from your distribution.
there's an online calculator you can use to find similar values using the z-score and using the raw score.
that calculator can be found at http://davidmlane.com/hyperstat/z_table.html
i'll use this calculator with raw scores.
to do that, you need to enter the mean and the standard deviation as given for the population.
that would be a mean of 480 and a standard deviation of 160.
here's the results for the area under the normal distribution curve to the right of a raw score of 600.
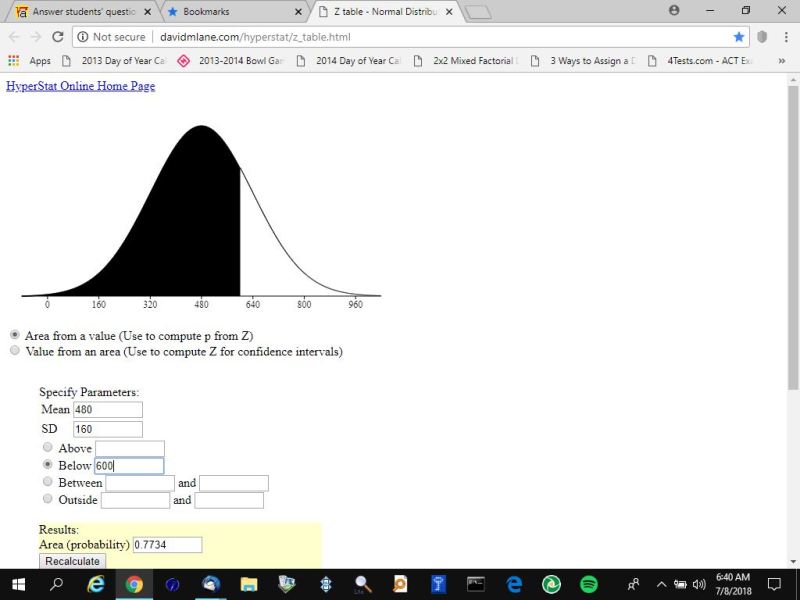
here's the results for the area under the normal distribution curve to the left of a raw score of 600.
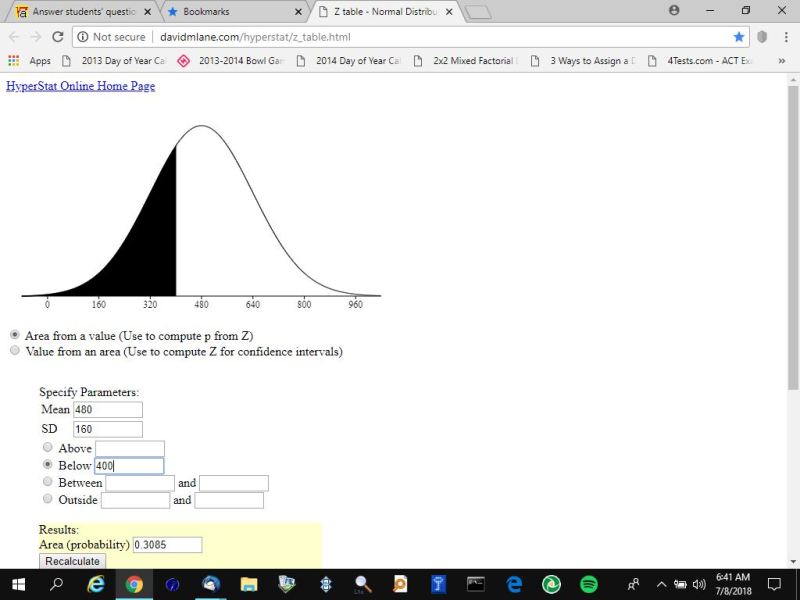
here's the results for the area under the normal distribution curve to the left of a raw score of 400.
here's the results for the area under the normal distribution curve between a raw score of 400 and a raw score of 600.
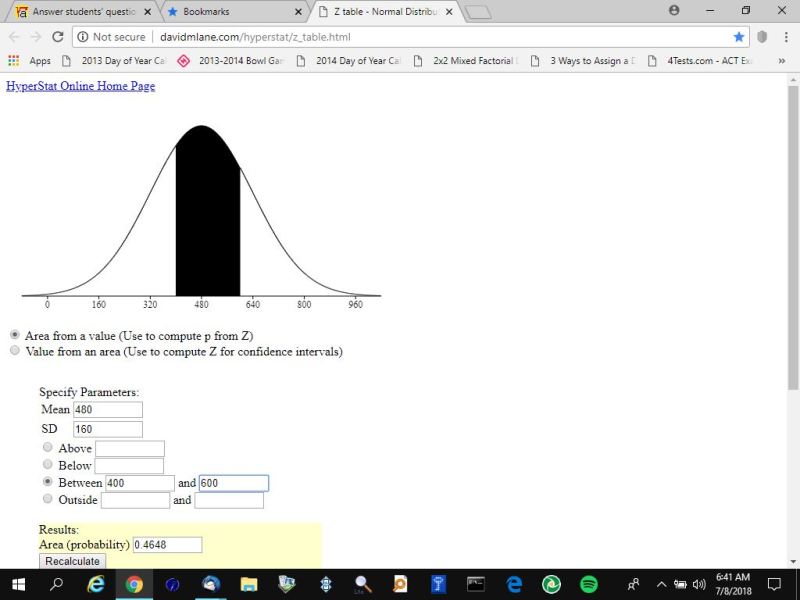
the numbers agree with my previous calculations if you round to 4 decimal places.
the same calculator can work off the z-scores as well.
in that case, you leave the mean at 0 and the standard deviation at 1.
|
|
|