Question 1113982: Let X be a normal random variable with zero mean and standard deviation u. Use the normal tables to compute the probabilities of the events { |X | ≤ k} and { |X| ≥ kσ} for k = 1 , 2, 3.
Answer by Theo(13342)   (Show Source): (Show Source):
You can put this solution on YOUR website! using the referenced normal distribution table, i get the following:
referenced table
area to the left of z-score of -1 = .1587
area to the left of z-score of 1 = .8413
area between z-score of -1 and z-score of 1 = .6826 ***** 1
area to the left of z-score of -2 = .0228
area to the left of z-score of 2 = .9772
area between z-score of -2 and z-score of 2 = .9544 ***** 2
area to the left of z-score of -3 = .0013
area to the left of z-score of 3 = .9987
area between z-score of -3 and z-score of 3 = .9974 ***** 3
if you used the TI-84 Plus Calculator and rounded your answer to 4 decimal digits, you would get:
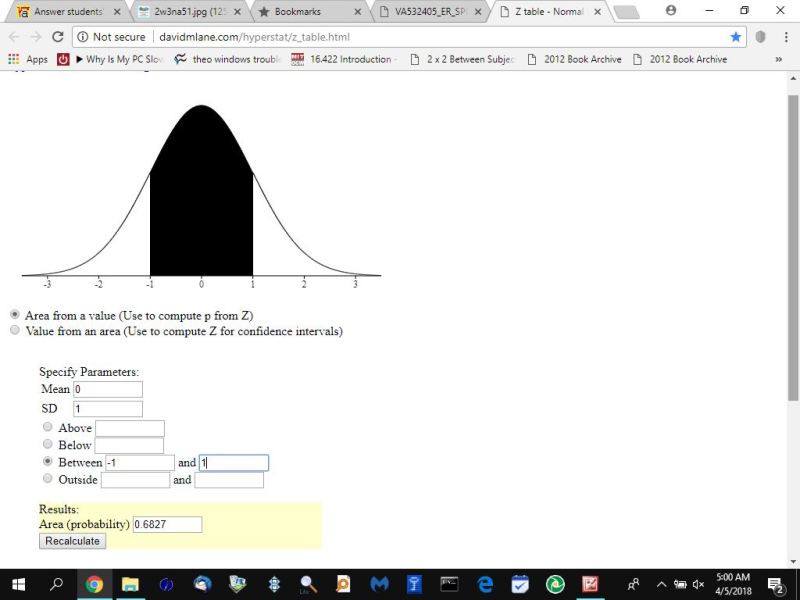
area between z-score of -1 and z-score of 1 = .6827 ***** 1
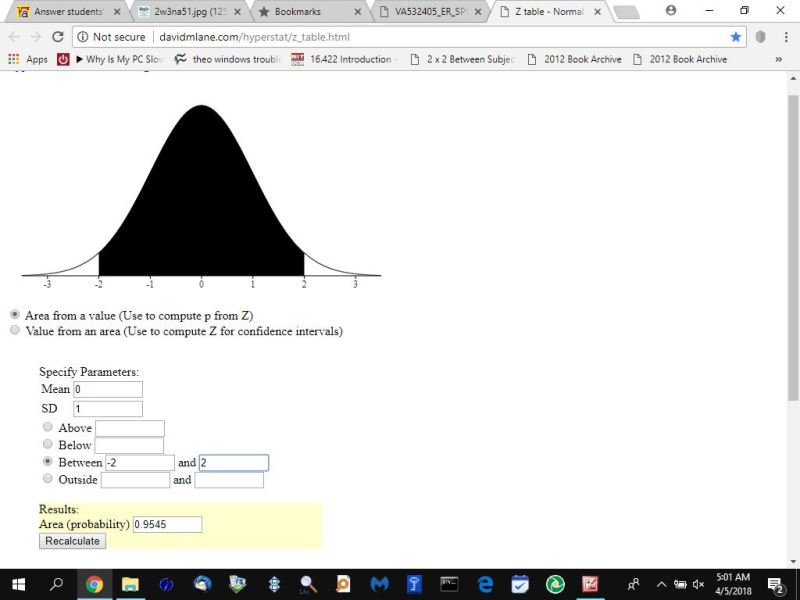
area between z-score of -2 and z-score of 2 = .9545 ***** 2
area between z-score of -3 and z-score of 3 = .9973 ***** 3
as you can see, there are some slight differences due to rounding.
there is a calculator online that will show you graphically what the distribution curve looks like and the values you desire to find.
that calculator can be found at http://davidmlane.com/hyperstat/z_table.html
using that calculator, i get the following:
for z-score of -1 to 1:
for z-score of -2 to 2:
for z-score of -3 to 3:

using the table, there are a couple of ways to get the area in between.
the first is to get the area to the left the z-score of -x and then get the area to the left of the z-score of x and then subtracting the smaller area from the larger area to get the area in between.
since the table is symmetric about the mean, you can also just get the area to the left of the z-score of x and then subtract .5 from that and then double the result.
for example, z-score of 3 give you area to the left of it of .9987.
.9987 - .5 = .4987
.4987 * 2 = .9974
per the table used, this is accurate.
you could also take .9987 and subtract (1 - .9987) from it, to get .9987 - 1 + .9987 = .9974.
there are also different types of normal distribution tables in use.
there's the full table as reference above.
there is also the half table as referenced below: normal distribution half table
this table will tell you the area between the indicated positive z-score and a z-score of 0.
for example:
area to the left of z-score of 3 = .4987.
if you want the area between a z-score of -3 and 3, you would simply double this to get .9974
if you want to get the full area to the left of the z-score of 3, you would add .5 to it to get .9987.
if you only wanted the area to the left of a z-score of -3, you would find the z-score of 3 to get .4987 and subtract it from .5 to get .0013.
the point being made is to make sure why type of normal distribution table you are dealing with.
most of the time it will be a full table, but sometimes you will see the half table.
if you use a calculator, you could ask the calculator to give you the area between a z-score of -x and x and the calculator will do all the arithmetic for you.
this is what i did using the TI-84 Plus, and using the online calculator referenced above.
|
|
|