SOLUTION: how is the graph of y=3x changed if we decreased its slope to zero?

Algebra ->  Linear-equations -> SOLUTION: how is the graph of y=3x changed if we decreased its slope to zero?       Log On


Question 807626: how is the graph of y=3x changed if we decreased its slope to zero?

Found 2 solutions by Alan3354, fcabanski:
Answer by Alan3354(69443) About Me  (Show Source):
You can put this solution on YOUR website!
how is the graph of y=3x changed if we decreased its slope to zero?
================
It's changed to a graph of something else.

Answer by fcabanski(1391) About Me  (Show Source):
You can put this solution on YOUR website!
y = mx + b is the slope intercept form of a line. m is the slope, b is the y intercept.


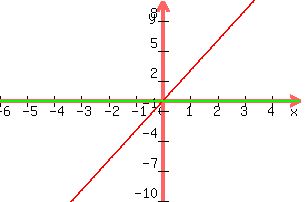
y = 3x is a line with a positive slope. It angles up away from the x axis.


If the slope is 0, the equation is y=0x which is y=0.


That graph is the x-axis.


Below, y=3x is the red line. y=0 is the green line.
+graph%28+300%2C+200%2C+-6%2C+5%2C+-10%2C+10%2C+3x%2C+0%29+