|
Question 734996: In a certain year, the amount of A garbage in pounds produced after t day by an average household is given by A=7.5t.
It wants me to graph graph equation for t is greater than 0. (dont have greater than sign on computer)
Then it wants me to tell them how msany days it will take to get 200 pounds of garbage.
Dont know where to even start????
Answer by josgarithmetic(39617)   (Show Source): (Show Source):
You can put this solution on YOUR website! The "greater than" sign is the keyboard character of the upper case part of the key with the period symbol; or likely the key two places to the right of the "m" key on the keyboard. If you want to say, "a" is greater than "b", then type, a>b, and to ensure type rendering enclose the inequality between triple-bracess, which is  on the right. These braces are not being displayed. I'm trying to show } and { but in their proper places. on the right. These braces are not being displayed. I'm trying to show } and { but in their proper places.
You are asked to adjust the graph for t>0, t greater than zero,  . This makes sense because the focus is not on garbage produced at a negative time value. . This makes sense because the focus is not on garbage produced at a negative time value.
For simple use of numbers as symbols, you wish to know t when A=200, you can begin with  , let , let  , and solve for , and solve for  . .


substitute for our given A,

 days or maybe 27 days to the nearest day. days or maybe 27 days to the nearest day.
As a graph, you are looking for something like this, but it would need to be adjusted to show only for t>0
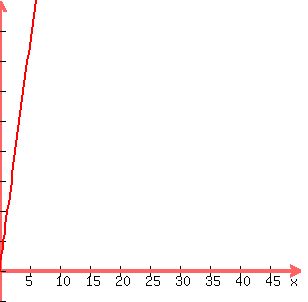
---each graduation mark vertically is five units.
|
|
|
| |